
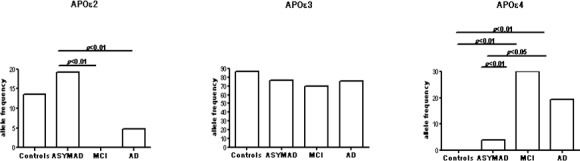
Figure 1. The figure shows histograms for the frequency distribution of APOε2, ε3, and ε4 alleles in the four different groups examined in the study.
Official websites use .gov
A
.gov website belongs to an official
government organization in the United States.
Secure .gov websites use HTTPS
A lock (
) or https:// means you've safely
connected to the .gov website. Share sensitive
information only on official, secure websites.