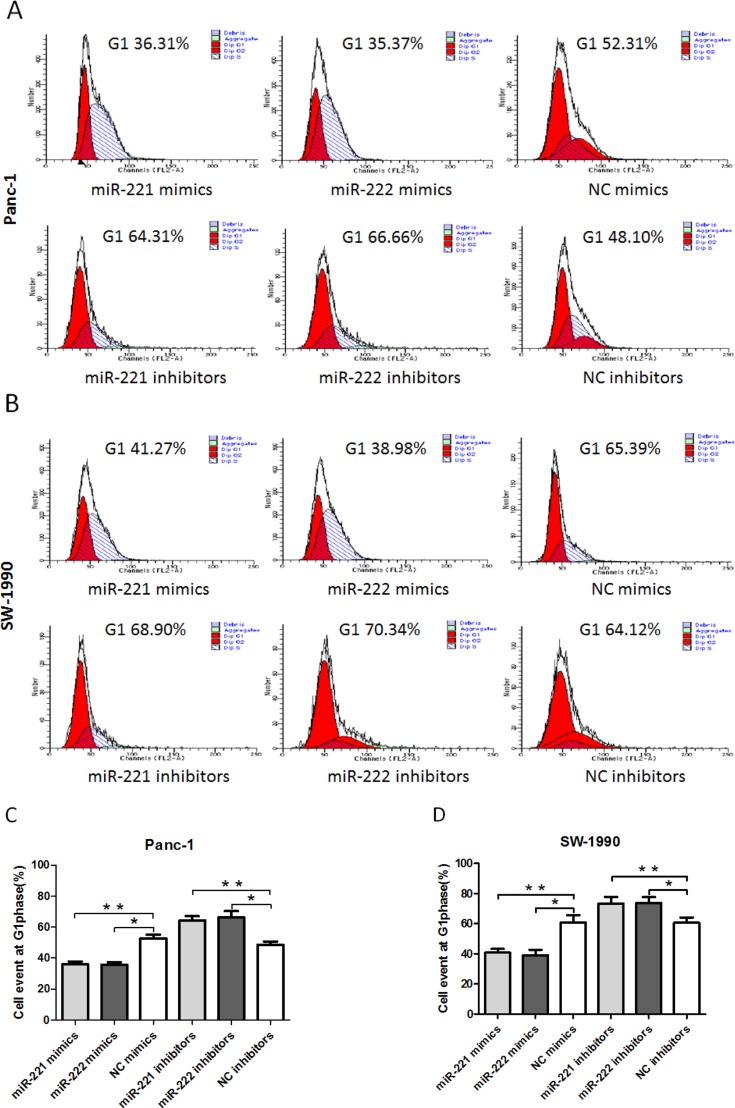
Figure 3. A FACS cell cycle analysis showed a G1 accumulation in Panc-1 and SW-1990 cells at 48 h after transfection of miR-221/222 mimics.
(A and B) Cell cycle analysis was performed by flow cytometry in Panc-1 or SW-1990 cells at 48 h after transfection of miR-221/222 mimics, inhibitors or negative controls. miR-221/222 mimic-transfected cells showed a decrease in the number of G1 phase cells (35.97 ± 1.93%/35.62 ± 1.73% in Panc-1 cells and 40.83 ± 2.43%/39.08 ± 3.65% in SW-1990 cells). In contrast, the miR-221/222 inhibitor-transfected cells had a significantly higher proportion of cells in G1 phase (64.19 ± 2.86%/66.16 ± 4.16% in Panc-1 cells and 73.42 ± 4.37%/73.81 ± 3.86% in SW-1990 cells). (C and D) Graphical representation of the FCM analysis in A and B (*p < 0.05). The data are expressed as the mean ± SD of three independent experiments.

