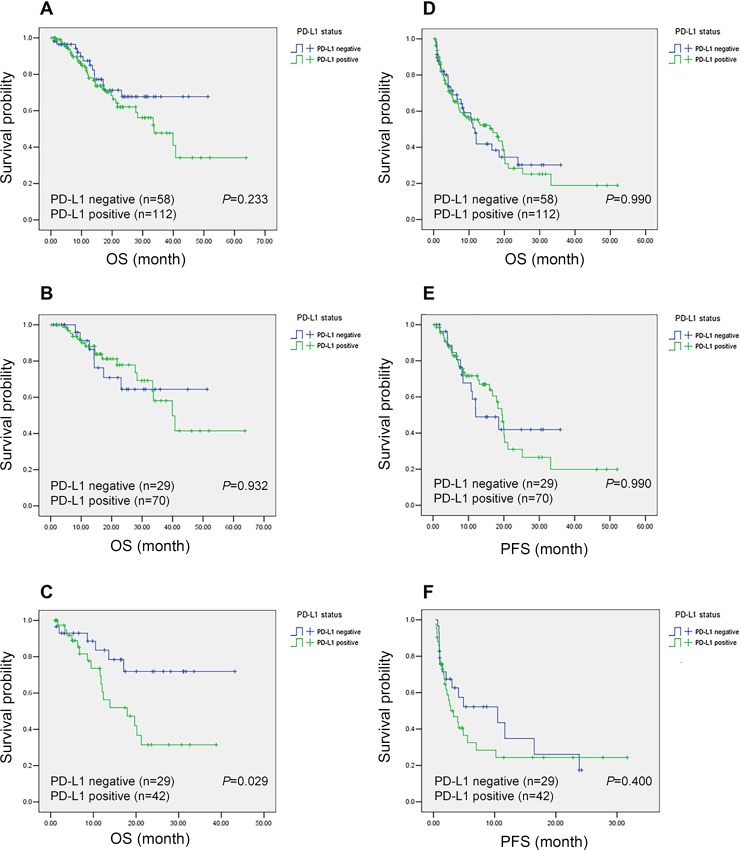
Figure 3. Kaplan-Meier curves of overall survival (OS) and progression-free survival (PFS) according to programmed cell death-ligand 1 (PD-L1) expression status in non-small cell lung cancer (NSCLC) patients.
The P value for the difference between the two curves was determined by the log-rank test. Notes: (A) OS for overall population. (B) OS for patients with EGFR mutation. (C) OS for patients with EGFR wild type. (D) PFS for overall population. (E) PFS for patients with EGFR mutation. (F) PFS for patients with EGFR wild type.

