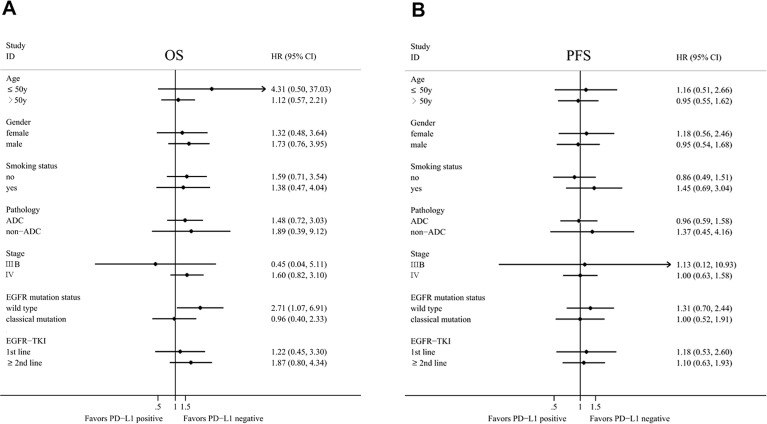
Figure 4. Forest plot of overall survival (OS) and progression-free survival (PFS) according to programmed cell death-ligand 1 (PD-L1) expression status in subgroup analysis.
Abbreviations: HR, hazard ratio, HR <1 implies a lower risk of progression or death for patients; 95% CI, 95% confidence intervals.

