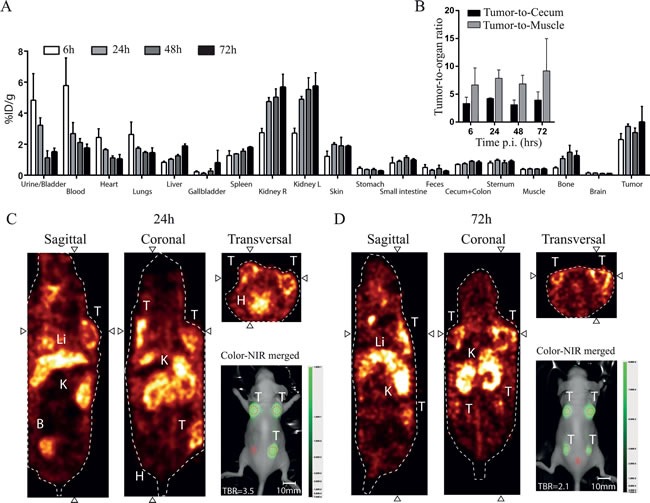
Figure 2. Biodistribution pattern of hybrid ATN-658.

A) Biodistribution data of hybrid ATN-658 in the HT-29 subcutaneous colorectal model in mice. Graph shows increased tumor uptake over time and decreasing signals in the urine, blood, heart and lungs, as determined by a gamma counter and represented as %ID/weight. B) Mean tumor-to-cecum and tumor-to-muscle ratios over time up to 72 h post injection are shown including standard deviations. Images show SPECT scans from C) 24 h (mouse with 3 tumors) and D) 72 h (mouse with 4 tumors) post injection, revealing the broad imaging window. Activity was seen in the tumors and the metabolizing organs (kidneys and liver). Inserted are representative NIR fluorescent images taken subsequent to SPECT imaging with the pre-clinical PEARL system at 24h and 72h post injection, showing the usability of the multimodal agent. Red dotted circles = Regions of interest (with B as Background), T= Tumor, Li= Liver, K= Kidney, B= Bladder, H=Heart.
