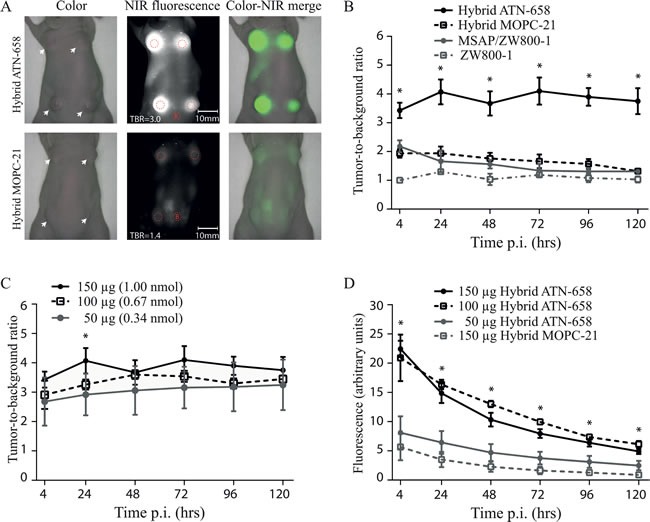
Figure 3. In vivo agent validation using the subcutaneous colorectal model.

A) UPPER ROW: The images show representative fluorescent signals in a mouse injected with 150 μg/1 nmol of hybrid ATN-658 and measured at 24 h post injection with a mean TBR of 4.1. White arrows indicate tumors. LOWER ROW: Mouse injected with 150 μg/1 nmol of hybrid MOPC-21 with a mean TBR of 1.6. White arrows indicate tumors. Red dotted circles = Regions of interest (with B as Background). B) TBRs over time up-to 120h post injection of mice receiving 1 nmol of the different agents. At each time point, at least 3 mice for each group were measured. Hybrid ATN-658 TBRs were significantly different from all three controls at all time-points. C) TBRs of various doses of hybrid ATN-658. Overall there were no significant differences between the TBRs of all three dose groups except at 24 h between 50 ug and 150 ug (p=0.05). Furthermore, a decreasing trend in TBR was seen in the lower dose groups. D) Absolute signals from the different dose groups and agents in the tumors. Significant differences were seen between the lowest dose group (50 μg/0.34 nmol), the control agent (15 0μg/1 nmol) and the two highest uPAR specific dose groups (100 μg/0.67 nmol and 150 μg/1 nmol) at all time points. Between the 150 μg hybrid ATN-658 and 100 μg hybrid ATN-658 were no significant differences found. A.U.= arbitrary units
