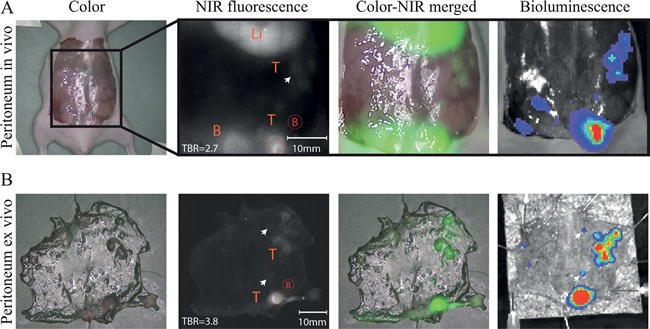
Figure 5. In vivo peritoneal carcinomatosis model.

A) In vivo images showed fluorescent rims around different sizes of peritoneal tumors/ metastasis (white arrow) which are validated using bioluminescence. Li= Liver, B= Bladder, T=Tumors. B) Ex vivo images of the peritoneal tumors/metastases confirmed the rim shaped signals around the tumors. T= Tumors. Arrows indicate very small metastases (≤1-2mm) which were fluorescently delineated. Red dotted circles = Regions of interest (with B as Background).
