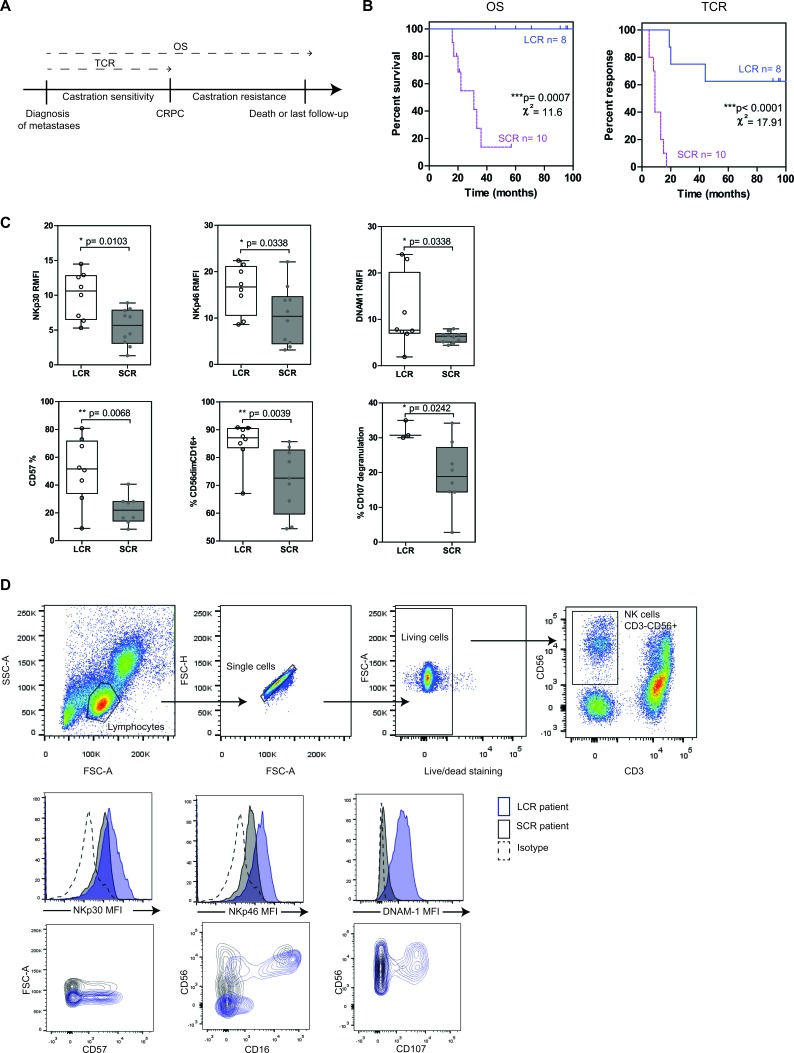
Figure 1. NK cells from mPC patients with longer survival and response to castration have strong cytotoxic potential.
mPC patients sampled within 2 months after diagnosis of metastases and without treatment at sample (n = 18) were stratified into two groups, according to the time to castration resistance with an 18-months cutoff value: LCR (long castration response, n = 8) and SCR (short castration response, n = 10) patients. A. Clinical endpoints analyzed in this study: overall survival (OS) and time to castration resistance (TCR). B. Kaplan-Meier curves of OS and TCR. Blue solid line, LCR patients; pink dashed line, SCR patients. The relative differences in survival and response distribution (χ²) and p values were determined by log-rank statistics. C. The expression of NK cell markers on peripheral NK cells was analyzed by flow cytometry in LCR (white plots) and SCR (grey plots) patients sampled at diagnosis. The y axis shows the MFI ratio or the percentage of NK cells (CD56+CD3-) positive for each marker depending on uni- or bimodal expression. Data are represented by “box and whisker (min to max; horizontal lines represent mean values)” graphs. P values were obtained using Mann-Whitney test. p < 0.05 = *; p < 0.01 = **; p < 0.001 = ***. D. Gating strategy for NK cells (CD56+CD3− among living lymphocytes) and representative histogram or dot plot for each NK cell marker.

