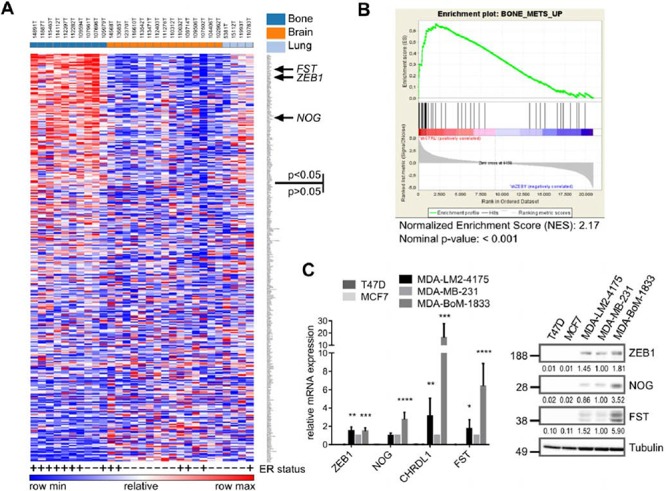
Figure 2. Genes positively regulated by ZEB1 are upregulated in breast cancer bone metastases.

A. Heatmap showing the differential expression of the top 350 ZEB1 target genes, determined from the MDA-MB-231 shCtrl vs. shZEB1 microarray, between bone metastases and other metastatic sites in a set of samples from bone, lung and brain metastases of breast cancer patients (GSE14020). The ER status is depicted with + or −. Genes were ranked according to differential expression in bone metastases vs. other metastatic sites by GENE-E program. 110 out of 350 genes are significantly higher expressed in bone metastases with p < 0.05. The sites of metastases, bone, brain and lung, are indicated in the top row in dark blue, orange and light blue, respectively. B. Gene-Set-Enrichment-Analysis reveals the gene set BONE_METS_UP (adapted from Kang 2003) as enriched in the shCtrl phenotype, which indicates the included genes to be downregulated after stable knockdown of ZEB1 in MDA-MB-231. C. The bone metastatic cell line MDA-BoM-1833 shows highest expression of BMP-inhibitors and ZEB1 when compared to parental MDA-MB-231, lung metastatic MDA-LM2–4175 and luminal breast cancer cell lines T47D and MCF7, analyzed by qRT-PCR and western blot. qRT-PCR data are represented as mean +SD.
