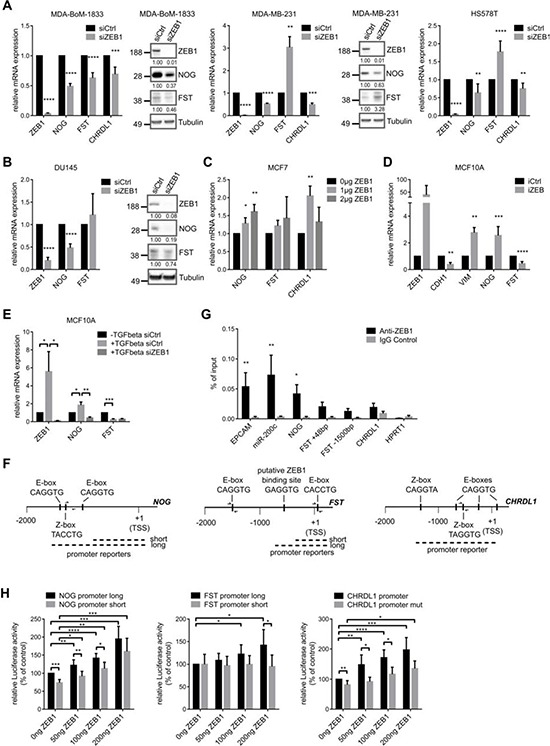
Figure 3. The expression of BMP-inhibitors is directly induced by ZEB1.

A. siRNA mediated knockdown of ZEB1 in MDA-BoM-1833, MDA-MB-231 and HS578T breast cancer cells results in decreased mRNA and protein expression of the BMP-inhibitors NOG, FST and CHRDL1 relative to siCtrl, as analyzed by qRT-PCR and western blot. In MDA-MB-231 and HS578T FST is regulated antagonistically to NOG. qRT-PCR data are represented as mean +SD. B. siRNA mediated knockdown of ZEB1 in DU145 prostate cancer cells results in decreased mRNA and protein expression of the BMP-inhibitors NOG and FST relative to siCtrl, as analyzed by qRT-PCR and western blot. qRT-PCR data are represented as mean +SD. C. qRT-PCR after transfection of different concentrations of ZEB1 overexpression plasmid in MCF7 cells reveals increased mRNA levels of NOG, FST and CHRDL1. qRT-PCR data are represented as mean +SD. D. MCF10A cells with inducible ZEB1 overexpression show increased mRNA expression of NOG, but FST expression is decreased as measured by qRT-PCR. Stable iCtrl and iZEB1 cells were treated with 1 μg/ml doxycycline for 6 days to induce ZEB1 expression. qRT-PCR data are represented as mean +SD. E. Induction of EMT in MCF10A cells by TGFβ treatment reveals upregulation of NOG, which could be reversed by siRNA mediated knockdown of ZEB1. FST is again regulated antagonistically. qRT-PCR data are represented as mean +SD. F. Schematic representation of the putative promoters of human NOG-, FST- and CHRDL1-genes on chromosomes 17q22, 5q11.2 and Xq23, respectively. The sequence-predicted ZEB1 binding sites (E- and Z-boxes, black boxes), the regions amplified after chromatin immunoprecipitation (ChIP) (half arrows represent primer pairs) and the location of the promoter reporter constructs are indicated. Numbers are in bp relative to the transcription start site (TSS). G. ChIP of endogenous ZEB1 in MDA-MB-231 cells shows direct binding of ZEB1 to the promoter of NOG, but with less efficiency to FST and CHRDL1. Promoters of EPCAM and miR-200c are used as positive controls, HPRT1 is used as negative control. qPCR data are represented as mean +SEM. H. Luciferase-reporter assays with pGL4.10-NOG promoter long, pGL4.10-FST promoter long and pGL3basic-CHRDL1 promoter reporters reveal dose dependent increase in luciferase activity after transient ZEB1 overexpression in MCF7 cells. Shorter promoter reporters of NOG and FST lacking the E-box containing regions show reduced activation by ZEB1. Similar results were obtained when E-boxes were deleted in the CHRDL1 promoter reporter (CHRDL1 promoter mut). Luciferase activity relative to control is represented as mean +SD.
