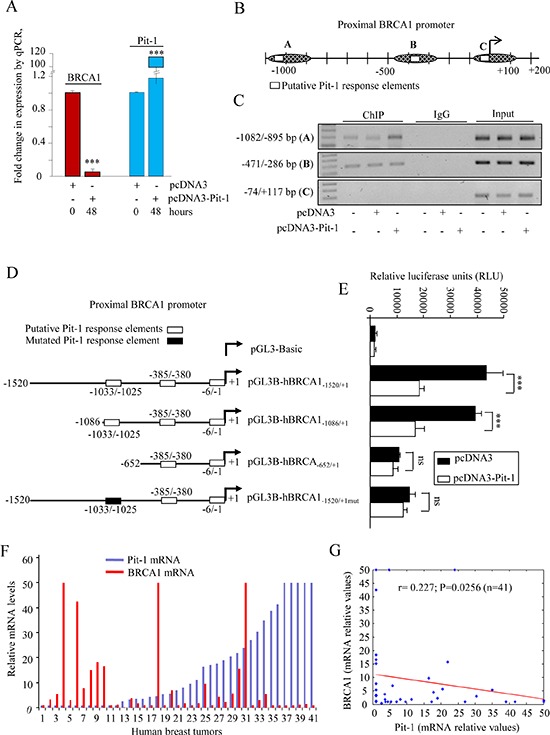
Figure 2. Pit-1 inhibits BRCA1 in breast cancer cells.

A. Quantitative PCR (qPCR) of BRCA1 and Pit-1 mRNA expression in control and Pit-1 overexpressing MCF-7 cells. BRCA1 and Pit-1 expression is plotted as mean ± SD of triplicates using 18S gene expression as control. *** = P < 0.001. B. Diagram of the human BRCA1 gene promoter showing the putative Pit-1 binding sites, and fragments amplified by primers used in the ChIP assay. C. Soluble chromatin prepared from control, pcDNA3, or pcDNA3-Pit-1 transfected MCF-7 cells was immunoprecipitated (IP) with an anti-Pit-1 antibody or control IgG. The IP DNA was amplified by PCR using primers (A, B, and C) that amplified regions of the BRCA1 promoter with the putative Pit-1 binding sites. D–E. BRCA1 promoter fragments were fused to the pGL3Basic vector (pGL3B) and transfected into MCF-7 cells. Then, cells were transfected with the pcDNA3 or the pcDNA3-Pit-1 overexpression vector. Normalized relative luciferase units (RLU) were calculated as the ratio of luciferase activity in the pcDNA3-Pit-1 transfected cells to that in the corresponding control (pcDNA3 transfected) cells. Data are plotted as mean ± SD of triplicates. *** = P < 0.001, ns = not significant. F–G. Pit-1 and BRCA1 mRNA was evaluated by qPCR in 41 breast tumor sample cDNA array. Dispersion plot indicates a significant negative correlation between Pit-1 and BRCA1 mRNA.
