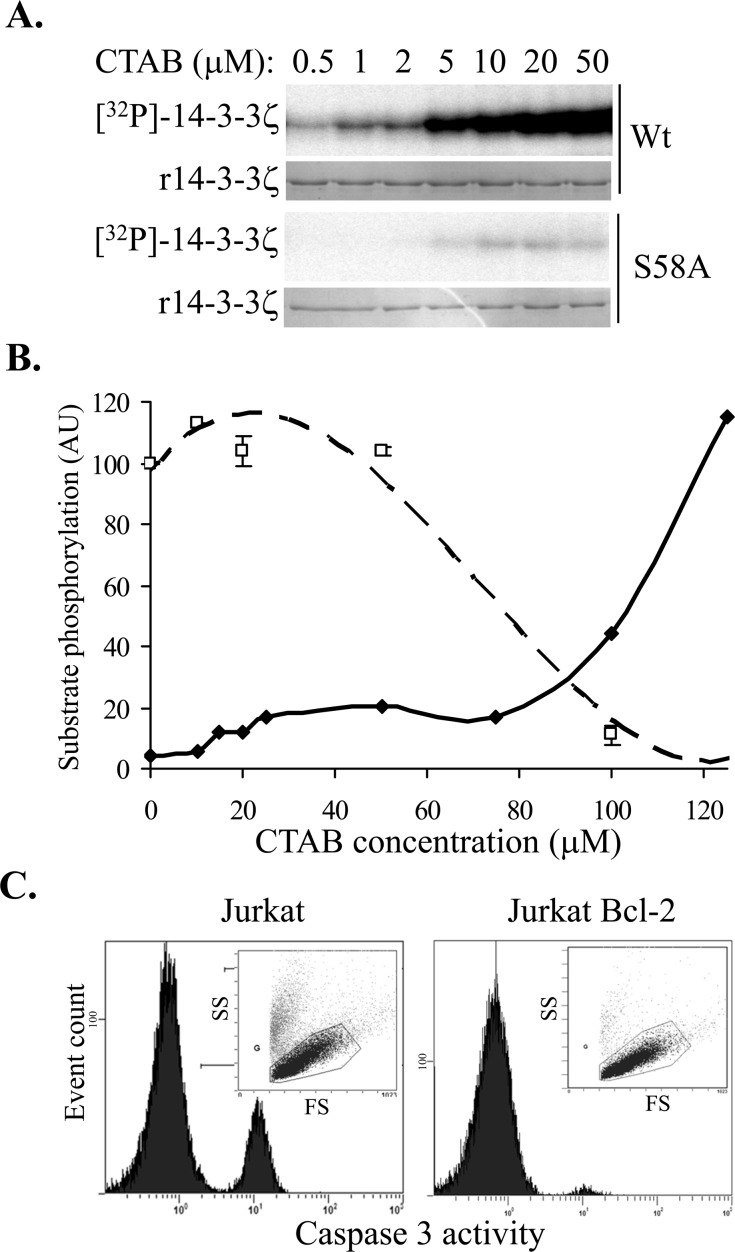
Figure 2.
A. In vitro phosphorylation of 14-3-3ζ (Wt and S58A) by PKA in the presence of increasing concentrations of CTAB (C16-TMA). B. Quantitation of 14-3-3ζ phosphorylation (solid symbols and solid line) and PKA activity (open symbols and dashed line) with increasing CTAB concentration. C. Effect of 5μM CTAB on cell viability (FS vs. SS plots inset) and caspase-3 activation (histograms) in parental Jurkat cells (left panel) and Jurkat cells over-expressing Bcl-2 (right panel) after 20 h.

