
Figure 1. Comparison of body weight and survival of nude mice without tumors after S. typhimurium A1-R or VNP20009 i.v. administration.
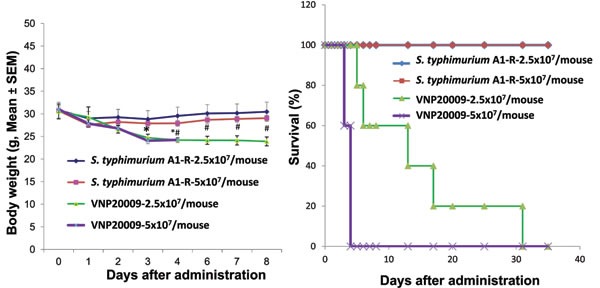
Female nude mice, aged 6 weeks, were injected iv with S. typhimurium A1-R or VNP20009 at different doses in 100 μl PBS. Body weight was monitored using an electronic scale. A: Body weight curve comparing S. typhimurium A1-R and VNP20009 at both doses (p<0.05). B: Kaplan Meir survival curve. n = 5 mice for each group comparing S. typhimurium A1-R and VNP20009 at both doses (p<0.05)