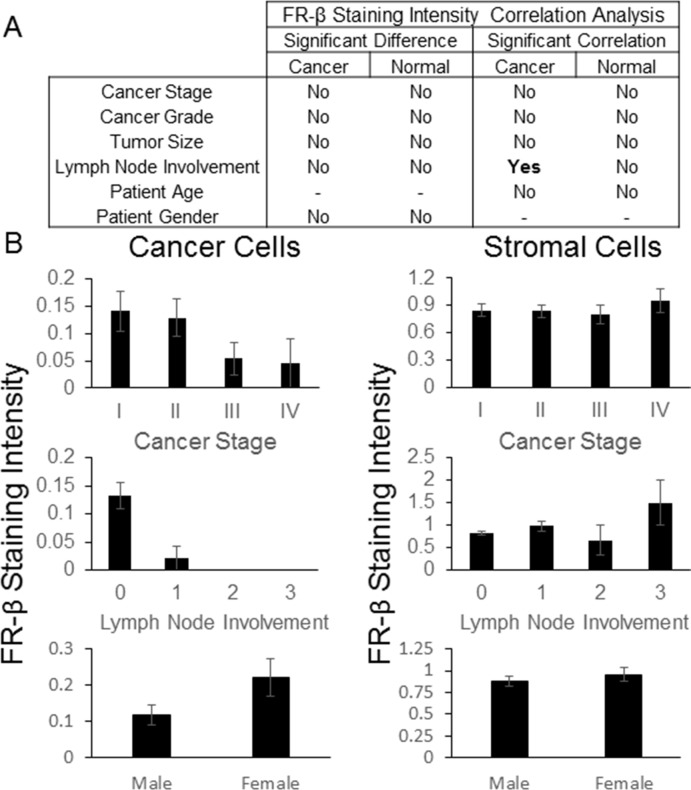
Figure 4. FR-β staining intensity correlations.
IHC was performed on a BioMax multi-cancer tissue microarray using the FR-β specific monoclonal antibody m909. The relative staining intensity, graded on a scale of 0 to 3, of positively staining cells within the tumor and stroma were determined. A) Statistically significant differences (p-value <0.05) using ANOVA or a t-test and correlations using a Spearman correlation (p-value <0.05) between the average FR-β staining intensity and various pathological data are summarized. B) Graphs for select FR-β staining intensity and various pathological data (error bars represent SEM) are shown. Lymph node involvement was based upon the AJCC/UICC stage - TxNxMx. Additional graphs and data can be found in the Supporting Information.

