
Fig. 1. Cleavage parameters of the catalytic domains versus the full-length enzymes of MMP-2 and MMP-9.
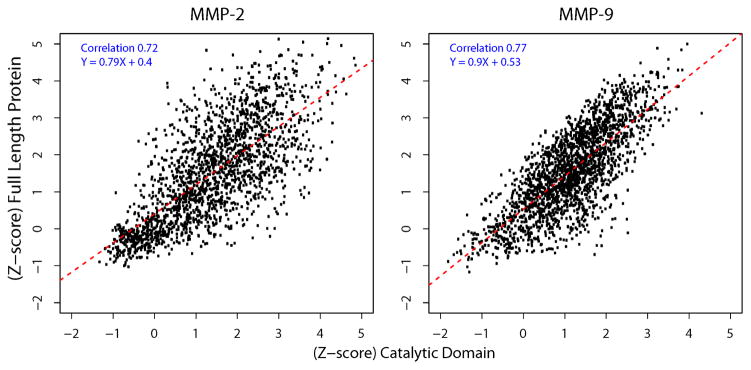
The X-axis and Y-axis denote the Z-score of substrate cleavage by the catalytic domain and by the full-length proteinase, respectively. Black dots represent selected substrates (1,902 for MMP-2 and 2,167 for MMP-9) with raw sequencing counts >10. Red dotted line represents a linear regression fitted line. Pearson’s correlation coefficient and regression equation are shown within the panels. Assays were performed in triplicate. Average correlation among the replicates was 0.92 (not shown). Average correlation between the full-length enzyme and the catalytic domain was 0.72 (MMP-2) and 0.77 (MMP-9).