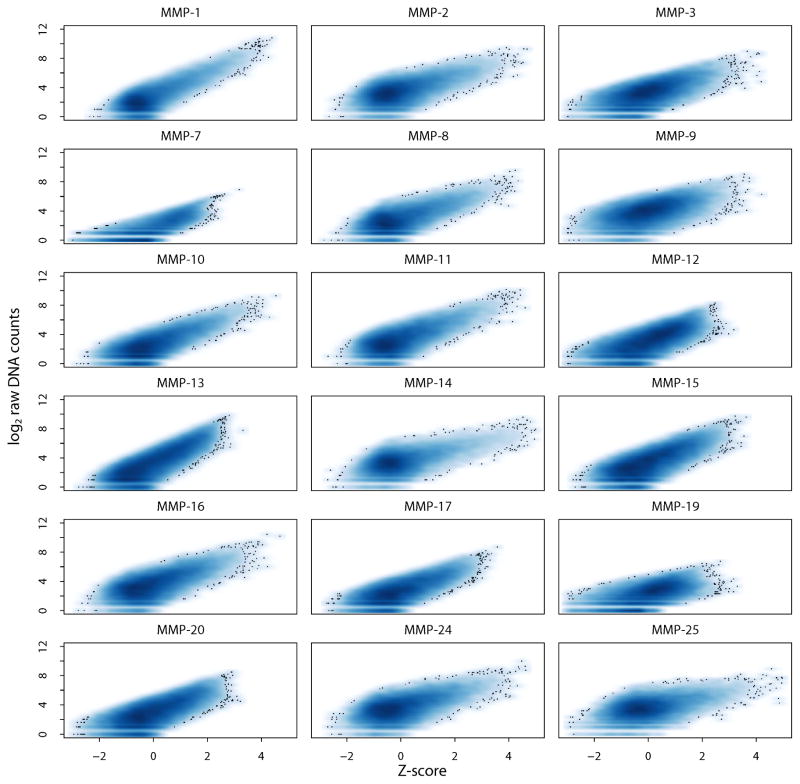
Fig. 2. Scatter density plot for the 18 MMPs.
Density plots of Z-score versus raw sequencing counts of 18,583 peptide substrates. X-axis and Y-axis denote the Z-score of substrate cleavage and log2 raw DNA counts in an MMP digest sample, respectively. Darker blue represents a higher density of substrates, with outlying substrates shown as dots (the Z-score >2.5; p-value <0.0062 by one tail test). All of the MMPs, except MMP-7 and MMP-19, exhibited >500 substrates with the Z-score >2.5. Because of a limited number of the efficiently cleaved peptide substrates, MMP-7 and MMP-19 were not analyzed further.

