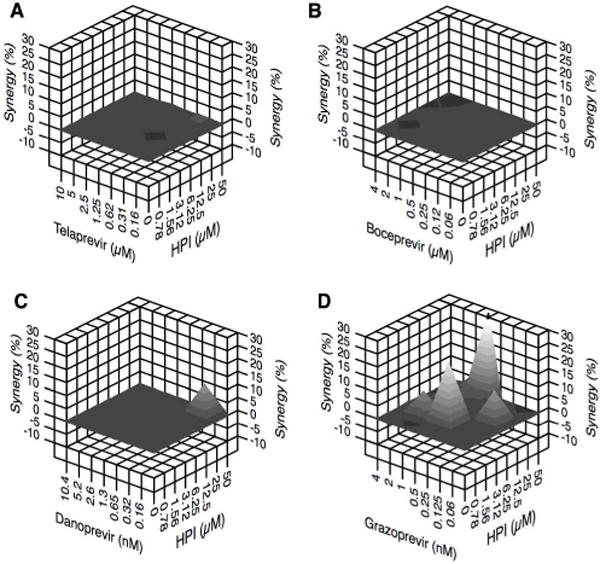
Figure 6. Interactions between HPI and other protease inhibitors.

Points on the z-axes represent the difference in replicon inhibition observed from the inhibition that would be expected if the two agents produced additive effects in the Bliss independence model when compounds inhibited the HCVsg 1b(con1)-Rluc replicon with the IC50 values listed in Table 1. In each 3D plot, combinations yielding synergy are progressively lighter grey. Data were analyzed using MacSynergy II.37
