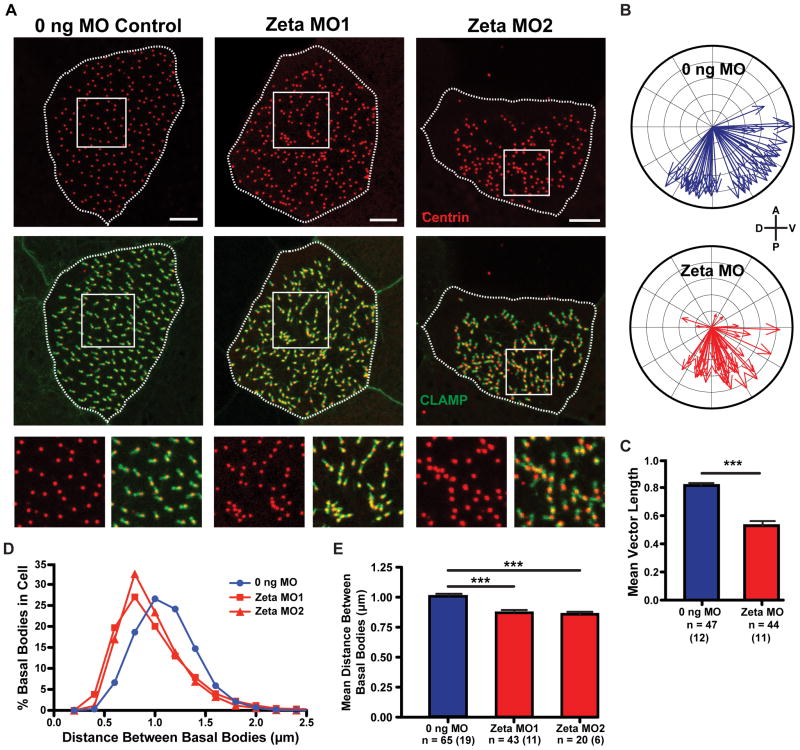
Figure 3. Zeta-tubulin depletion disrupts basal body orientation and spacing.
A) Tadpole epidermal multiciliated cells in morphant and control embryos co-expressing CLAMP-GFP (green) and centrin-(RFP or BFP) (red). Clumps of basal bodies indicated by arrowheads and insets. Scale bars, 5 μm. B) Quantification of mean rootlet angle from experiments as in A). Each arrow represents one cell, where length indicates uniformity of rootlet angles in that cell. Mean cellular rootlet orientation was statistically similar between morphants and controls (mean vector angle −64.4° in controls and −74.8° in morphants, Watson-Williams). Number of cel ls counted is as in C). C) Vector length of plots shown in B) is significantly reduced in morphants (***p < 0.0001, Mann-Whitney). n = Number of cells counted, with total number of embryos in parentheses. D, E) Quantification of basal body clumping phenotype from experiments as in A). n = Number of cells counted, with total number of embryos in parentheses (shown in E). D) The distance between each basal body and its nearest neighbor shown as average percentage of binned nearest neighbor distances for each condition. E) Mean distance between basal bodies; this is significantly reduced in morphants (***p < 0.0001, Mann-Whitney). See also Figure S4.

