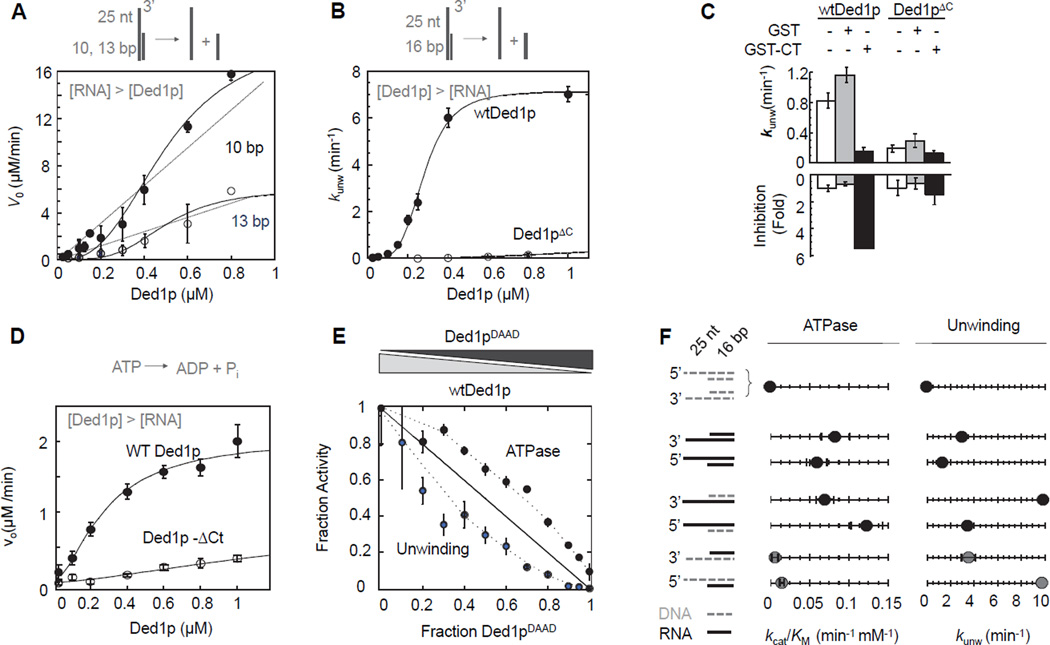
Figure 2. Connection between oligomerization, ATPase and helicase activity.
(A) Unwinding of two RNA substrates (2 µM) with differing duplex length under steady-state conditions with increasing concentrations of Ded1p. Data points here and in all subsequent figures are averages from multiple independent measurements (N ≥ 3) and error bars represent one standard deviation, unless indicated otherwise. Dashed lines indicate the dependence of the unwinding rate expected for a monomeric enzyme. Solid lines mark a trend.
(B) Unwinding of a 16 bp RNA substrate (0.5 nM) under pre-steady state conditions with increasing concentrations of Ded1p and Ded1pΔC. Solid lines are the best fits to the Hill equation (for wt Ded1p:kunwmax = 7.4 ± 0.2 min−1,K1/2 = 320 ± 40 nM, H = 3.2 ± 0.1; for Ded1pΔC: no meaningful datafit)
(C) Inhibition of unwinding by Ded1p, but not Ded1pΔC with the C-terminal domain of Ded1p. Measurements were performed with 0.5 nM RNA (13bp, 25 nt 3’ ssRNA), 300 nM Ded1p,900 nM Ded1pΔC, 0.4 mM ATP, 1.0 µM GST-Ded1p-Ct or GST.
(D) RNA-stimulated ATPase activity with 50 nM RNA (16 bp, 25 nt 3’ ssRNA) at indicated concentrations of Ded1p and Ded1pΔC. Solid lines are the best fits to the Hill equation (for wt Ded1p:Vmax = 2.1 ± 0.2 µM·min−1, K1/2 = 220 ± 60 nM, H = 1.6 ± 0.2; for Ded1pΔC: no meaningful datafit)
(E) Inhibition of helicase and RNA-stimulated ATPase activities of Ded1p with Ded1pDAAD, measured at 0.5 nM (unwinding) or 50 nM (ATPase) RNA (16 bp duplex with 3' 25 ntssRNA), 1 µM total protein concentration ([Ded1p]+ [Ded1pDAAD]), and 2 mM ATP. Activities are plotted as a fraction of the activity of 1 µM wtDed1p. The solid line indicates the expected result for a monomeric enzyme. Dashed mark a trend.
(F) Comparison of unwinding and ATPase activity of wtDed1p for a series of RNA-DNA hybrid substrates (cartoons on the left - grey broken line: DNA; black solid line: RNA). Values for kcat/Km for ATP hydrolysis were obtained with 2 µM nucleic acid substrate, 0.4 µM Ded1p, as in Fig. 3A, values for kunwmax for unwinding with 0.1 nM substrate, 2 mM ATP/Mg2+, as in Fig. 2B. See also Figure S2.

