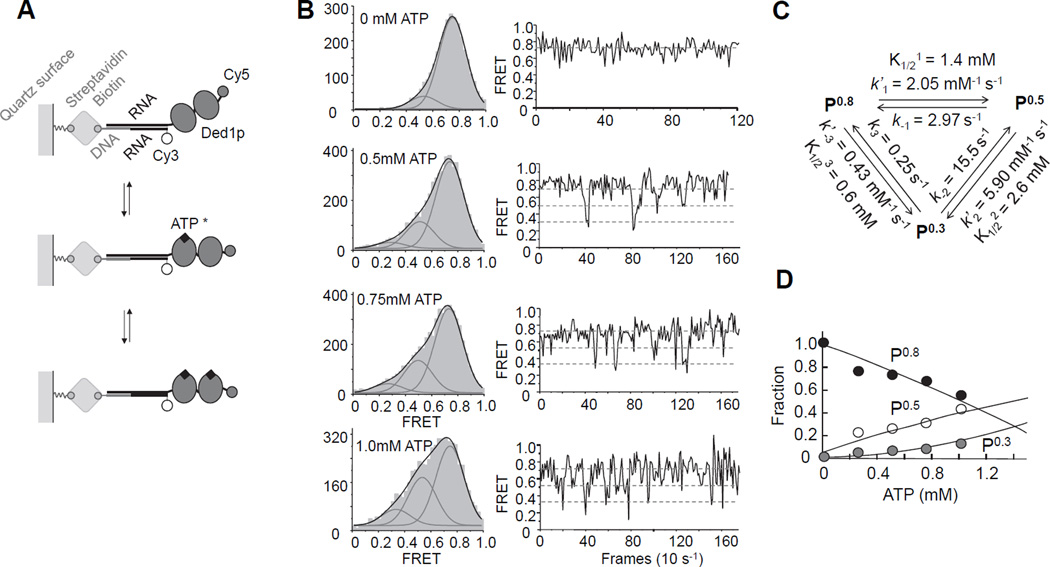
Figure 4. Analysis of ATP binding to the loading protomers by single molecule FRET.
(A) Schematics for the single molecule FRET measurements.
(B) Left column: smFRET Histograms for Ded1p binding to the RNA with increasing concentrations of ATP/Mg2+, as indicated. Grey curves represent best fits to individual Gaussian distributions, black curves the sum of the individual distributions. Right column: representative time traces for reactions in the presence of increasing concentrations of ATP/Mg2+, as indicated in the histograms. Dashed lines mark the three FRET states.
(C) Association and dissociation rate constants for ATP/Mg2+, and associated equilibrium dissociation constants.
(D) Fraction of each FRET state calculated from smFRET histograms as function of the ATP/Mg2+ concentration. Lines are the best fit of the experimental data to the model shown in panel (C). See also Figure S4.

