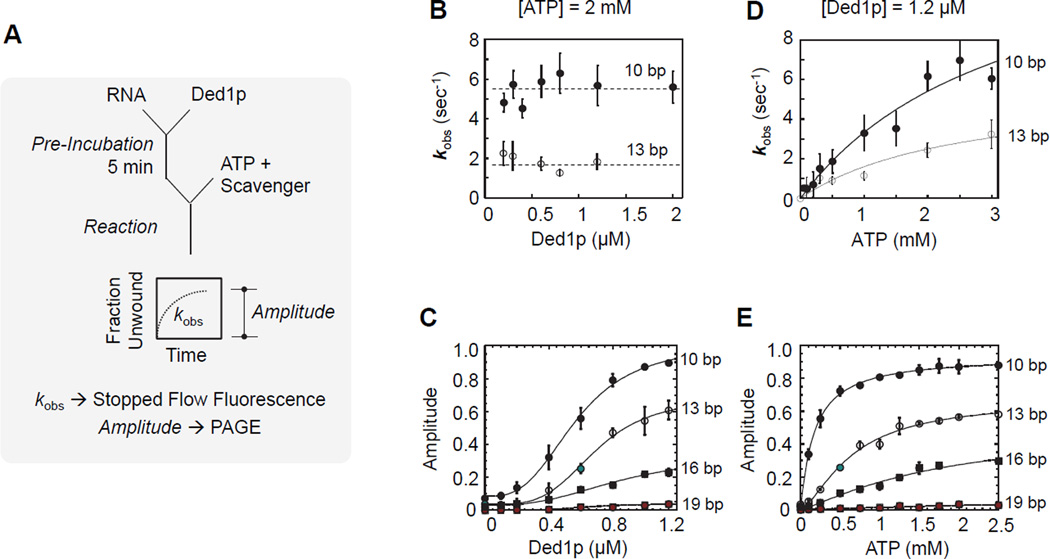
Figure 5. Characterization of the unwinding protomer under single cycle conditions.
(A) Reaction scheme for a single cycle unwinding reaction.
(B) Observed unwinding rate constants (kobs) under single cycle conditions for two substrates containing a 25 nt unpaired region 3' to duplex with 10, and 13 bp, respectively, as function of increasing Ded1p concentrations. Unwinding reactions were measured by stopped-flow fluorescence spectroscopy.
(C) Unwinding amplitudes for a series of substrates (duplex lengths as indicated, identical 25 nt unpaired regions 3' to the duplex) as function of increasing Ded1p concentrations. Amplitudes were measured by PAGE (Figure S5).
(D) Observed unwinding rate constants (kobs) under single cycle conditions for the substrate used in panel (C), as function of increasing ATP concentration at 1.2 µM Ded1p. The black solid line marks a binding isotherm.
(E) Unwinding amplitudes for the substrates in panel (C) as function of increasing ATP concentrations at 1.2 µM Ded1p. Deconvolution of unwinding and dissociation rate constants, and resulting amplitudes as function of increasing ATP concentrations are shown in Figure S5.

