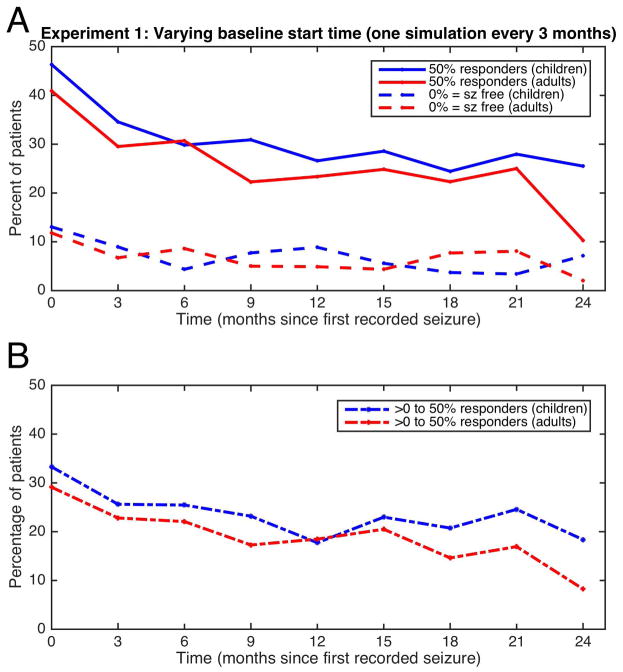
FIGURE 1.
Experiment 1: Multi-baseline experiments. Each time on the x-axis represents a single experiment, which started a certain number of months after time 0. Each experiment resulted in a certain percentage of patients experiencing 50% reduction in seizures (solid lines, upper graph), seizure-freedom (broken lines, upper graph). The difference between the 50% reduction and seizure free groups are represented in the lower graph. Children are represented in blue, adults are in red.

