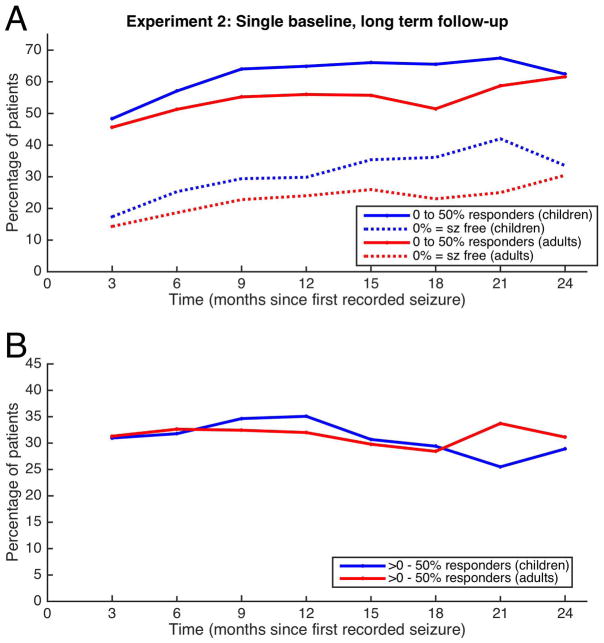
FIGURE 2.
Experiment 2: Single baseline experiment. A single baseline was obtained at time zero, and multiple test times (each of 3 month duration) were measured at regularly spaced intervals in time. The resulting 50% responders and seizure-free patients are plotted for each time point, separating out children (blue) from adults (red). The lower tracing shows the difference between the 50% responder rate and the seizure-free rate for each time point.

