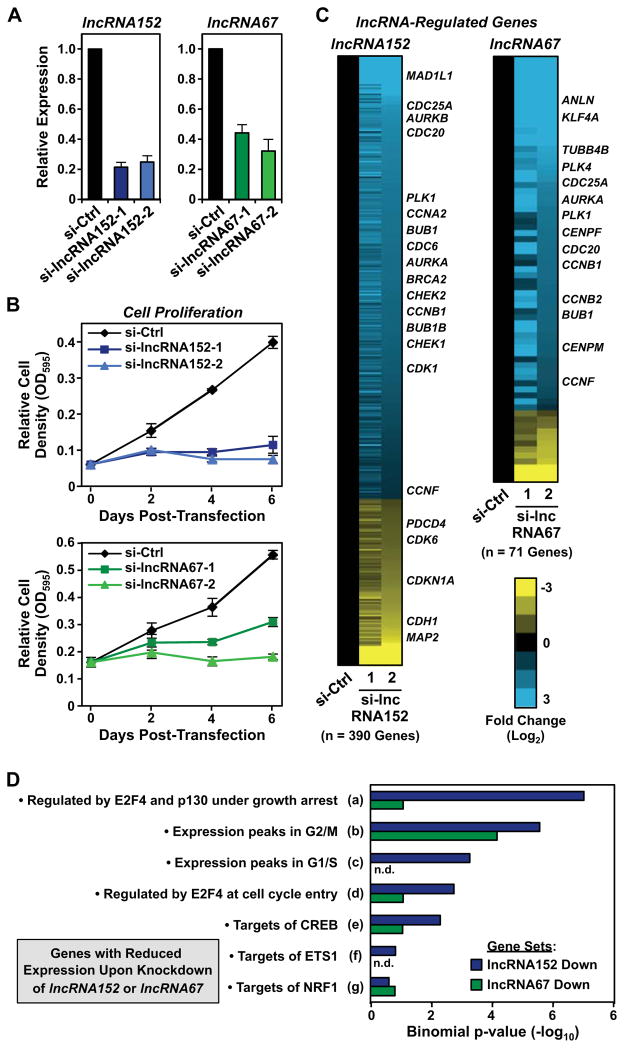
Figure 6. LncRNA152 and lncRNA67 are required for cell cycle-related gene expression programs and the growth of breast cancer cells.
(A) siRNA-mediated knockdown of lncRNA152 (left) or lncRNA67 (right) in MCF-7 cells using two independent siRNA oligos. The expression of lncRNA152 and lncRNA67 after knockdown was monitored by RT-qPCR. β-actin mRNA was used as an internal control. Each bar represents the mean + SEM, n = 3.
(B) Analysis of the growth of MCF-7 cells after control (si-Ctrl) or siRNA-mediated knockdown of lncRNA152 (top) and lncRNA67 (bottom) (si-lncRNA152 and si-lncRNA67, respectively) over 6 day time course post-transfection. Each point represents the mean ± SEM, n = 3.
(C) siRNA-mediated knockdown of lncRNA152 (left) or lncRNA67 (right) alters gene expression in MCF-7 cells. Heat maps showing the relative expression lncRNA-regulated genes and their associated fold changes (log2) in expression upon knockdown of lncRNA152 or lncRNA67 calculated from RNA-seq FPKM values.
(D) Transcription factor target analysis using the GREAT analysis tool performed on the high-confidence set of RefSeq genes downregulated upon siRNA-mediated knockdown of lncRNA152 or lncRNA67. The full gene set descriptors can be found in Figure S7A.
See also Figure S6.

