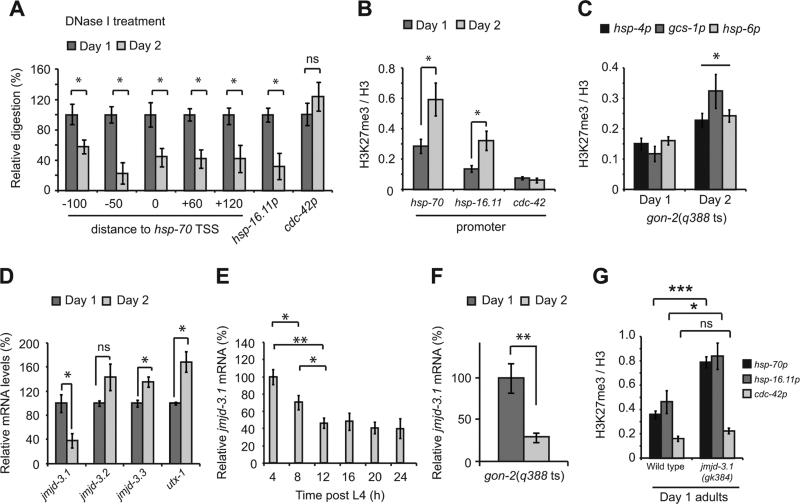
Figure 4. Increased H3K27me3 and repression of heat shock gene induction is due to reduced jmjd-3.1 expression.
(A) DNase I digestion of chromatin isolated from gon-2(q388ts) animals. Values are plotted as the relative degree of digestion compared to day 1 adults for each genomic region. (B and C) H3K27me3 ChIP-qPCR on gon-2(q388ts) worms. (D–F) H3K27me3 demethylase expression relative to rpb-2 in (D and E) wild type (WT) or (F) gon-2 (q388ts) worms. (G) H3K27me3 ChIP-qPCR in WT and jmjd-3.1(gk384) null mutants. Primers used were the same as those in HSF-1 and RNA pol-2 ChIP-qPCR experiments. Values plotted in panel A are the mean of at least 3 biological replicates. All other values plotted are the mean of at least 4 biological replicates and error bars represent SEM. Statistical significance was calculated by Student's t-test (A-D, F and G) or one-way ANOVA with Tukey post analysis comparison (E) * p <0.05, ** p <0.01, *** p <0.001, ns p > 0.05. TSS = Transcription start site. hsp-70p = promoter of C12C8.1. See also figure S4.

