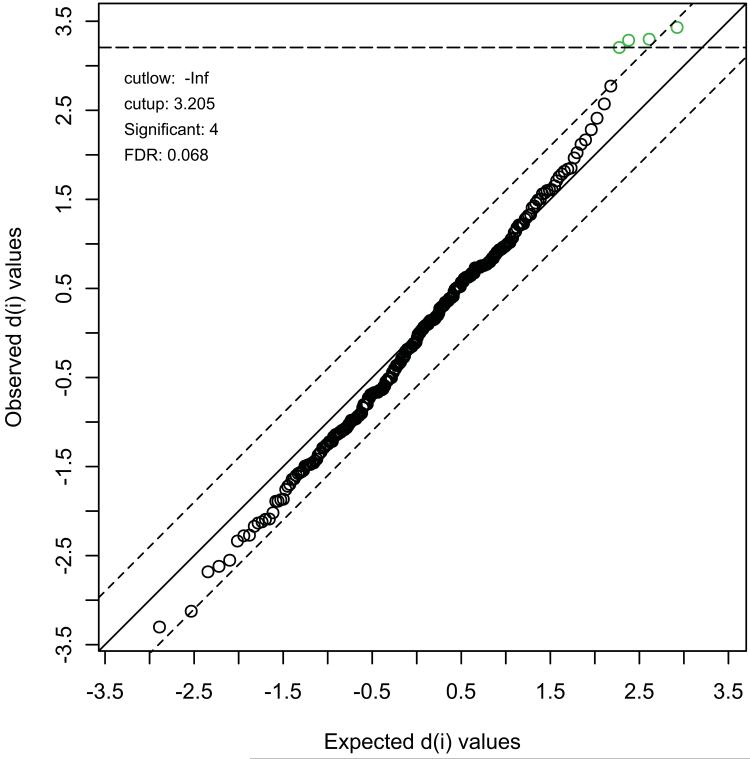
Figure 1.
Statistical Analysis of Microarrays (SAM), as implemented in MetaboAnalyst and applied to our metabolomics data. The plot shows observed (y-axis) compared to expected (x-axis) values of the d(i) statistic. This represents the ratio of difference in metabolite levels between groups to the variation observed in the data for that metabolite. Thresholds (delta = 0.6) were adjusted to control the FDR < 0.1. Four compounds, all down-regulated in haloperidol-treated animals, passed FDR control at threshold = 0.068, as indicated in the plot.

