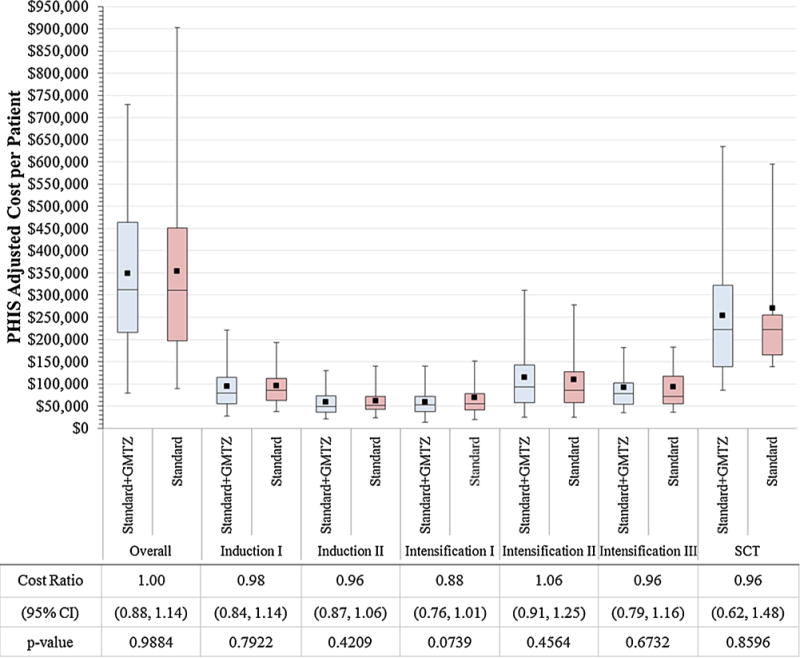
Fig. 1.

Comparisons of overall and course-specific PHIS adjusted costs per patient by treatment arm. The horizontal lines that form the top and bottom of each box are the 75th and 25th percentiles, respectively. The horizontal line that intersects the box is the median. The whiskers present the 5th and 95th percentiles. The solid squares represent the mean values. Cost Ratios compare cost by treatment regimen (standard + GMTZ vs. standard). Abbreviations: GMTZ = gemtuzumab ozogamicin; SCT = stem cell transplant; CI = confidence interval.
