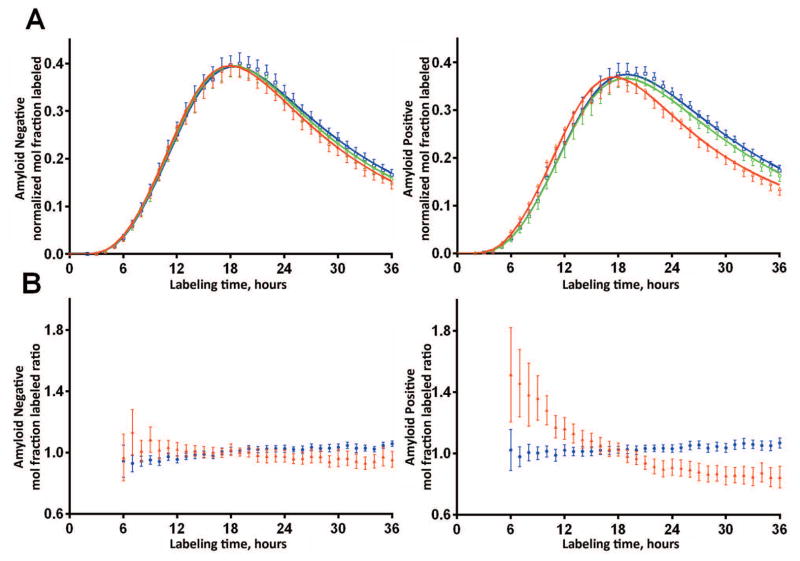
Figure 3. Aβ42 kinetics are altered in brain amyloidosis.
A. SILK Aβ time course profiles of the isotopic enrichment of Aβ peptides normalized to plasma leucine for each participant of Aβ38, Aβ40, and Aβ42 show altered Aβ42 kinetics in the amyloid positive group (mean ±95% CI). Amyloid negative participants (PET PIB MCBP < 0.18 or CSF Aβ42/Aβ40 concentration ratio >= 0.12, n=51) shown on left, amyloid positive participants (n=49) shown on right. Solid lines represent the mean model fit to the data. Blue: Aβ38; Green: Aβ40; Red: Aβ42.
B. SILK labeled Aβ isoform ratios ≠1 demonstrate altered Aβ42 kinetics in the amyloid positive group (Blue: Aβ38/Aβ40 ratio; Red: Aβ42/Aβ40 ratio, mean ±95% CI). The amyloid negative group demonstrated similar kinetics of all three Aβ isoforms.

