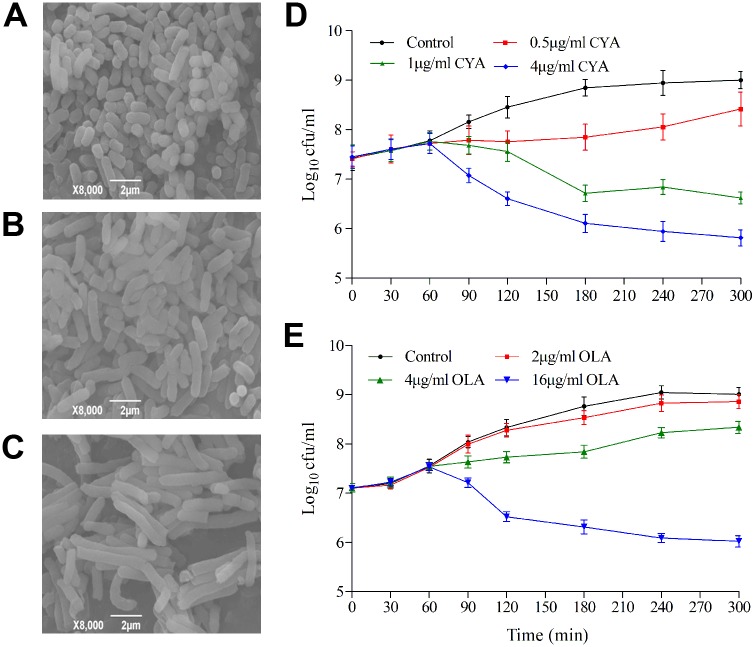
Fig 2. Growth of E. coli CVCC2943 exposed to QdNOs.
(A-C) Morphology of E. coli CVCC2943 exposed to CYA. Bacteria were treated with 1% DMSO as a control for 24 h (A) or with 1 μg/ml CYA for 4 h (B) and 24 h (C) under anaerobic conditions. The bacterial morphology was observed by SEM as described in materials and methods. (D, E) Killing curves of E. coli CVCC2943 exposed to QdNOs. The bacteria were exposed to 0.5 (0.5×MIC), 1 (MIC), and 4 μg/ml (MBC) CYA (D), and 2 (0.5×MIC), 4 (MIC), 16 μg/ml (MBC) OLA (E), or with 1% DMSO as a control.

