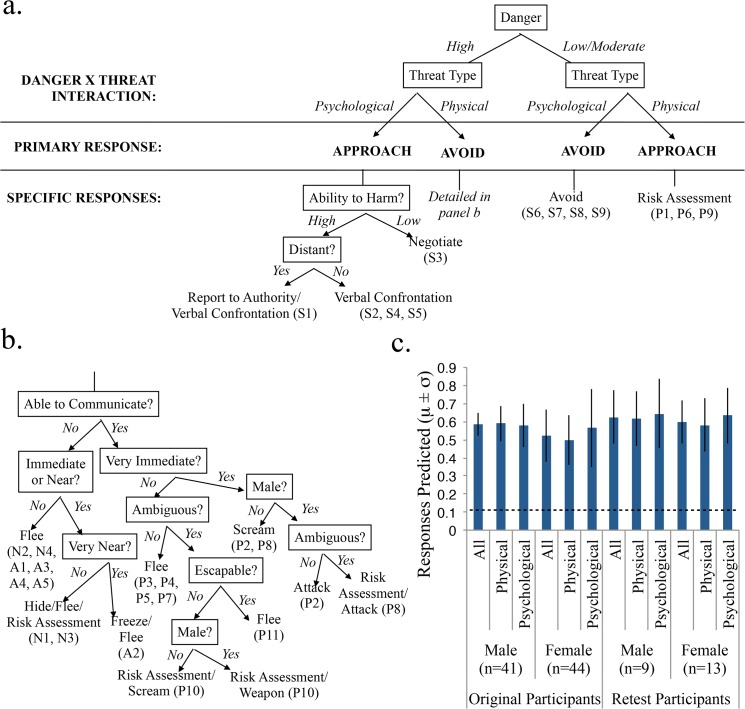
Fig 3. Decision Tree for Defensive Behaviors to Threatening Scenarios.
Panels a, b. Decision tree predicting the defensive behavior chosen by the majority of subjects based on characteristics of that threat scenario. The tree consists of four main branches, with primary approach/avoid responses predicted by the 2x2 interaction of danger (high, moderate) and threat type (psychological, physical threat). Appraisal of factors along further nodes predicts specific defensive responses for each scenario, denoted by the scenario labels used in Table 2. Where appropriate, gender differences are noted. The tree successfully predicts the group majority decisions of both original subjects (n = 85) and separate replication study subjects (n = 22) for all scenarios. Panel c. The average proportion of original and replication study subjects’ first responses correctly predicted for all scenarios (n = 29), physical scenarios (n = 20), and psychological scenarios (n = 9). Male and female performance reported separately. Dashed line around 0.12 (All: 0.128; Physical: 0.130; Psychological: 0.123) represents chance performance.

