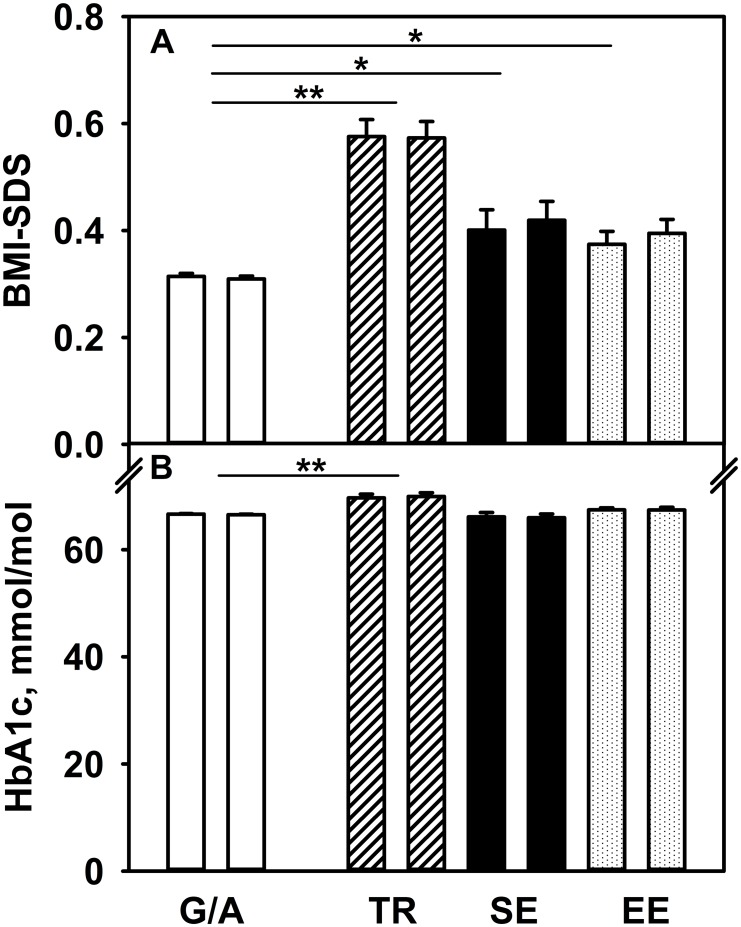
Fig 2. BMI-SDS (A) and glycemic control (B) in type-1-diabetes, depending on maternal (left bar) or paternal (right bar) country of birth.
G/A Germany/Austria (white bar), TR Turkey (hashed bar), SE Southern Europe (black bar), EE Eastern Europe (dotted bar), *p<0.05, **p<0.001. Given are adjusted estimates (±SE) based on multivariable regression modeling. Adjustments were made for age, sex and duration of diabetes. To convert HbA1c in %: (mmol/mol-value ÷ 10.929) + 2.15.

