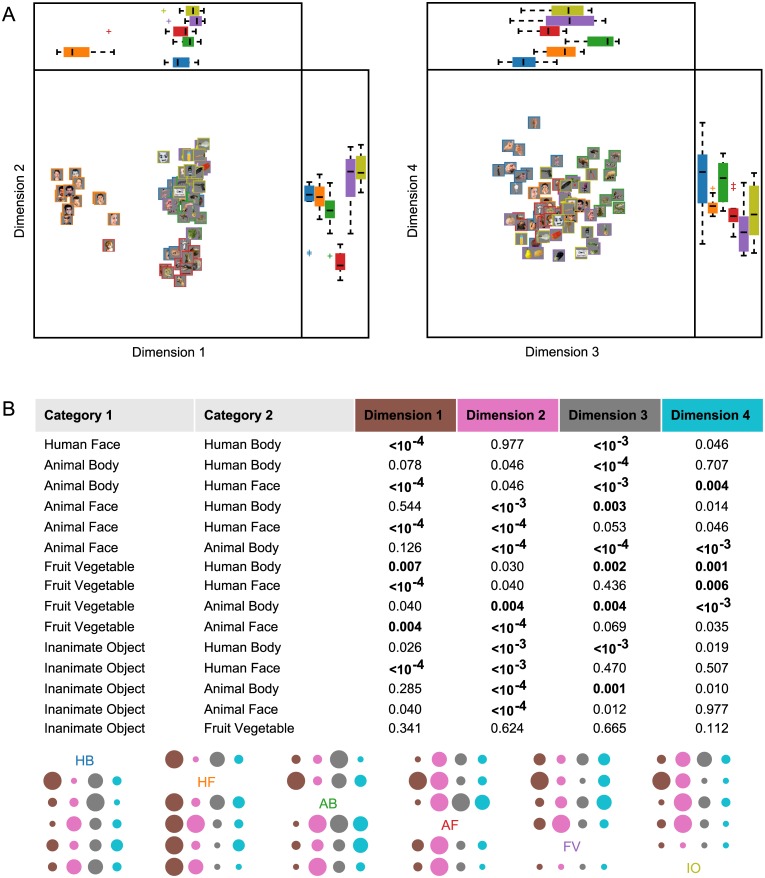
Fig 8. Multidimensional scaling plots for exemplar-level classification.
MDS coordinates were derived from the 72-class confusion matrix (Fig 7). (A) The first four MDS dimensions are scatterplotted in pairs of dimensions. Boxplots show the distribution of image exemplar coordinates along each dimension, grouped by the category labels used previously (as in Fig 3). (B) Statistical significance of category separability along each of the four principal MDS dimensions plotted in (A). Nonparametric tests were performed on exemplar coordinates for MDS Dimensions 1–4 to assess category separability; all category pairs except for the two Inanimate categories are separable at the α = 0.01 level along at least one of the four principal MDS dimensions.

