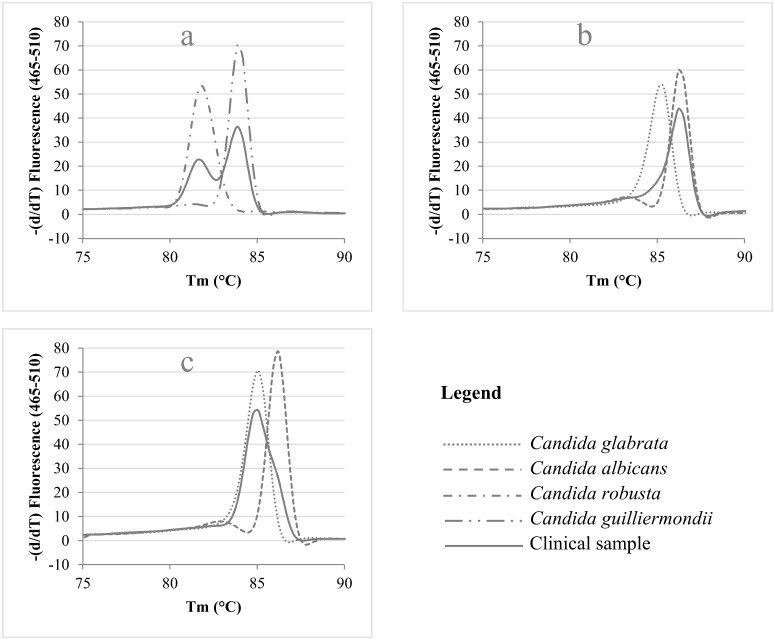
Fig 2. ITS2 High Resolution Melting Curve Analysis of clinical samples containing two Candida species.
The melting curve of the sample (solid line) containing two species (according to culture results) is plotted against the melting curves of the standard strains (dotted curves) of the two respective species.

