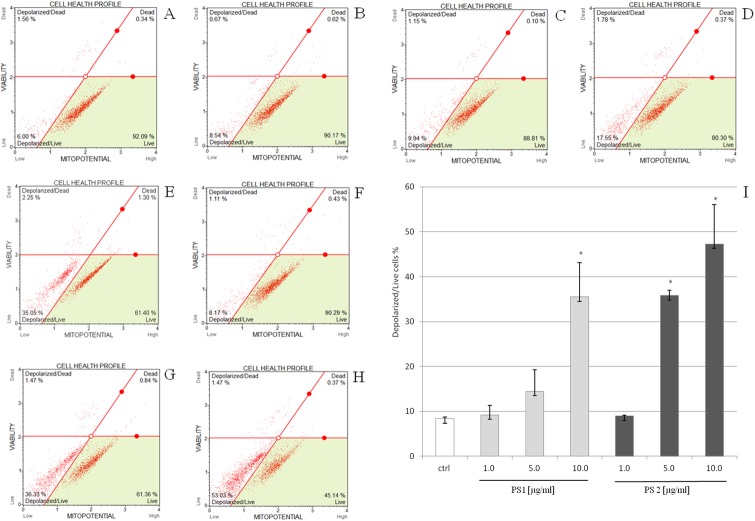
Fig 6. Pennogenyl saponins-induced changes in transmembrane mitochondrial potential in HeLa cells as determined by flow cytometry.
The distribution of the cells undergoing loss of mitochondrial potential was determined after incubating the untreated cells (A), the cells with 1.0% DMSO (B), the compound PS 1 (C-E) and PS 2 (F-H) at a concentration of 1.0, 5.0, 10.0 μg/ml, respectively. The cells were treated for 3 h and the extent of mitochondrial cell depolarization was determined in comparison to the DMSO control (I). Each sample was run in triplicate. Error bars represent standard deviations. Significant differences relative to the control are marked with an “*” (p<0.05).

