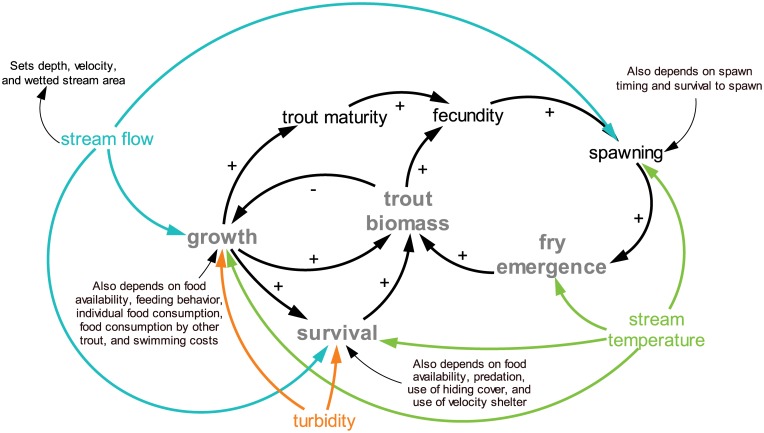
Fig 1. Representation of Key Processes in inSTREAM.
We highlight how the daily time series inputs of stream temperature, flow, and turbidity drive individual growth and survival and hence population dynamics including responses of fry emergence and biomass. A more detailed explanation of inSTREAM can be found in [20–21].

