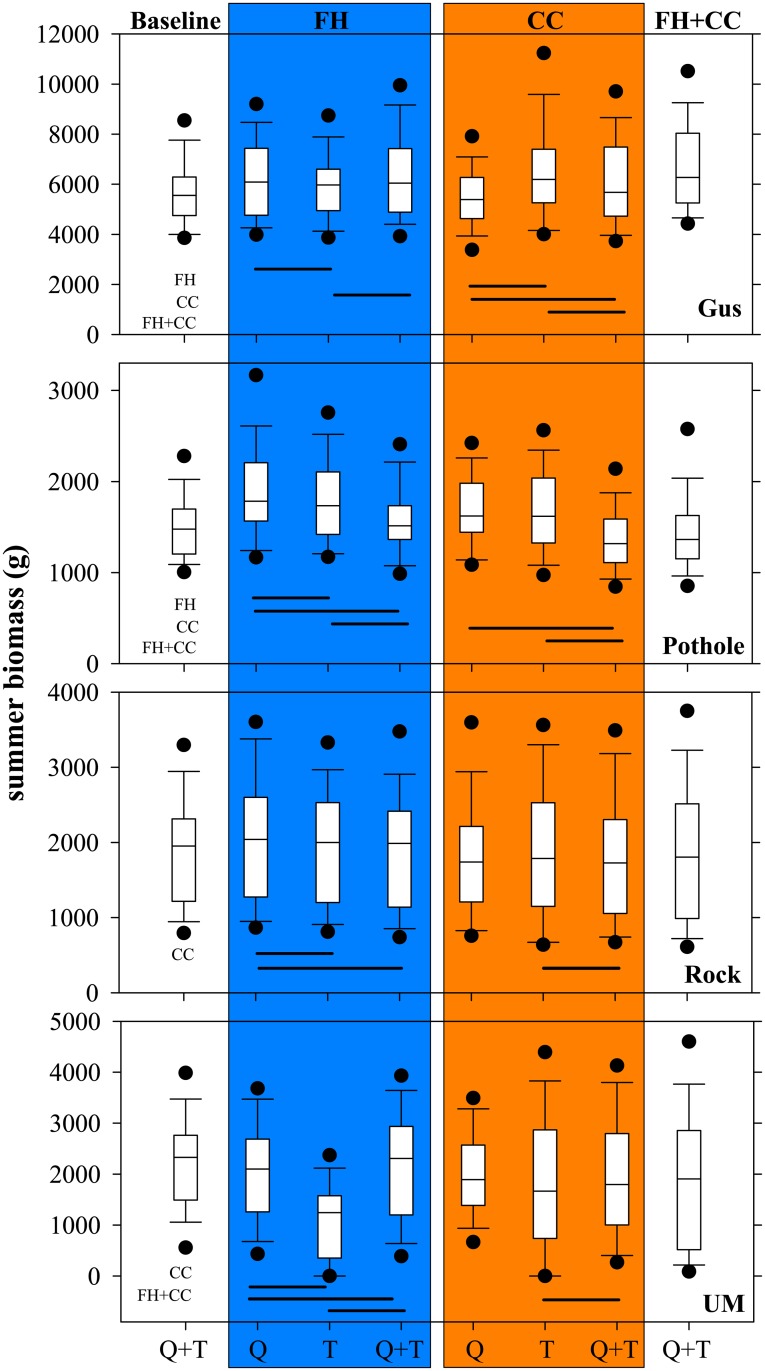
Fig 3. Influence of Flow and Temperature on Trout Biomass within each Scenario.
Boxplots of mean total summer biomass (g) of trout in Gus Creek, Pothole Creek, Rock Creek, and Upper Mainstem (UM) from five replicate simulations over the entire study period. Each boxplot incorporates 63 data points of the mean of every year’s summer biomass per scenario. Gray boxes represent pairwise comparisons of the influence of flow (Q), stream temperature (T), and both (Q+T) within each scenario of forest harvest (FH) and climate change (CC). Baseline and the combined scenarios (FH+CC) are shown for reference. Scenarios include manipulations of stream temperature and flow regimes (see methods narrative for detail). Significant pairwise differences are shown by a horizontal black line (P < 0.05). Significant differences between baseline and each scenario are noted. The point above or below each boxplot corresponds to the 5th and 95th percentile.

