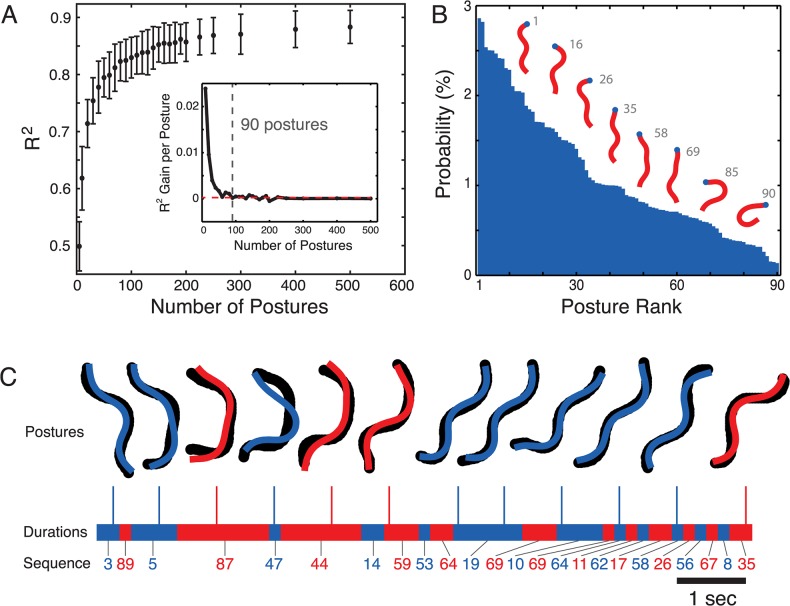
Fig 1. Discrete representation of worm locomotion by clustering.
(A) As the number of template postures increases, the R2 of the fit between original body angles and nearest neighbour matches increases (points show mean ± standard deviation for 50 worms, 15 000 frames each). The inset shows the rate of increase in R2 for increasing k. The red dashed line is the average increase in R2 per posture for k = 100–500 (2.4 x 10⁻⁴ per posture). (B) Probability of observing each of the 90 template postures. Selected postures are shown as skeletons with the head indicated by the blue dot. The grey label indicates their rank by frequency with 1 being the most common posture. (C) Locomotion is represented by a series of discrete template postures. In each frame, the original skeleton (black) is represented by its nearest neighbour (coloured overlay) in the set of 90 template postures. The duration spent in each posture is also recorded and shown as the alternating coloured bands. Each segment of repeated postures is collapsed to a single label and it is this sequence of states that represents locomotion (i.e. {3, 3, 89, 5, 5, 5, 5, 87, 87, 87, …} becomes {3, 89, 5, 87}).

