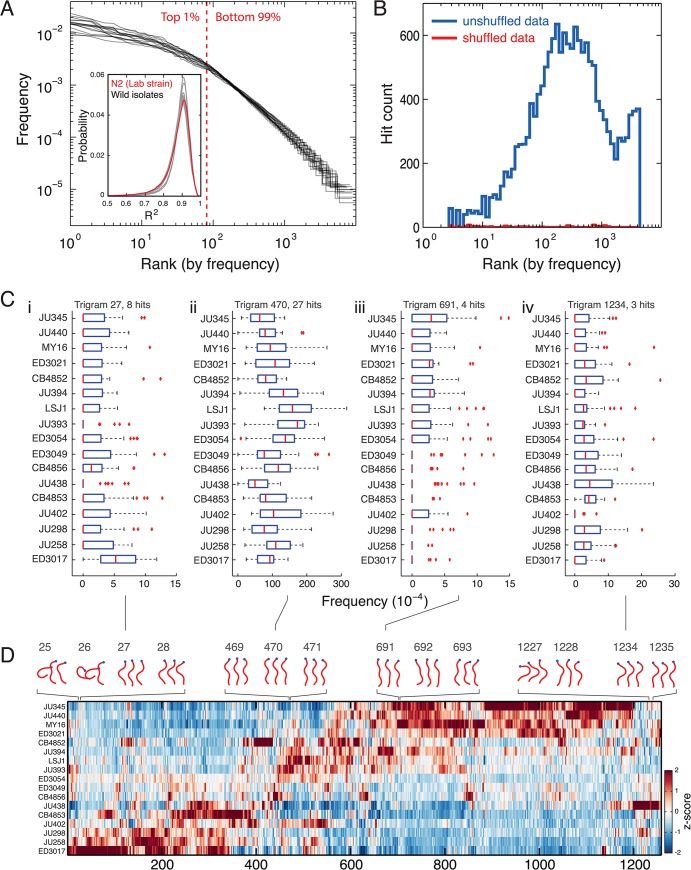
Fig 5. Form of trigram frequency distribution is conserved across wild isolates despite differences in preference for particular sequences.
(A) Zipf plots for 17 wild isolates of C. elegans all show a heavy tailed distribution similar to N2 worms. The red dashed line shows the rank dividing the top 1% of trigrams in the repertoire from the remaining 99%. The inset shows the distribution of R2 values for fits between 90 N2-derived templates and the original postures for the 17 wild isolates as well as for N2 itself for comparison. The overall mean of the distributions is 0.86 with standard deviation 0.08. (B) Histogram of hit counts (not hit density) versus frequency on a log scale. Hits are trigrams with significantly different frequencies in at least one pairwise rank sum test comparing strains. Note that the bin widths increase to be constant on a log-scale. Blue line is the original data and the red line is for trigrams derived from the same data after random shuffling of the sequences. (C) Box plots of trigram frequencies for 4 trigrams showing hits in several strains. The trigram number indicates its column in the heatmap in D. The p-value threshold was set at 1.1 x 10⁻⁴ to control the false discovery rate at 5% across comparisons. (D) A heatmap showing the relative frequency of all of the trigrams with significantly different frequencies in at least one strain comparison. Strains and trigrams have been hierarchically clustered. Sample trigrams are plotted above the heatmap with their columns indicated by the gray numbers.

