
Fig. 1.
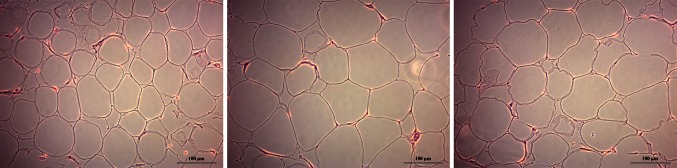
Digital photographs of the subcutaneous adipose tissue (SAT) paraffin slides from a control and obese subject without and with type 2 diabetes, respectively. Photographs were taken with an AxioCam ERc 5s camera placed on an Axioskop 20 light microscope at ×20 magnification. Mean surface area of adipocytes was measured using the ZEN 2011 software by indicating margins of all complete adipocytes imaged on the slides, expressed in µm2. Presented images were randomly selected. Scale bar represents 100 µm