Figure 1.

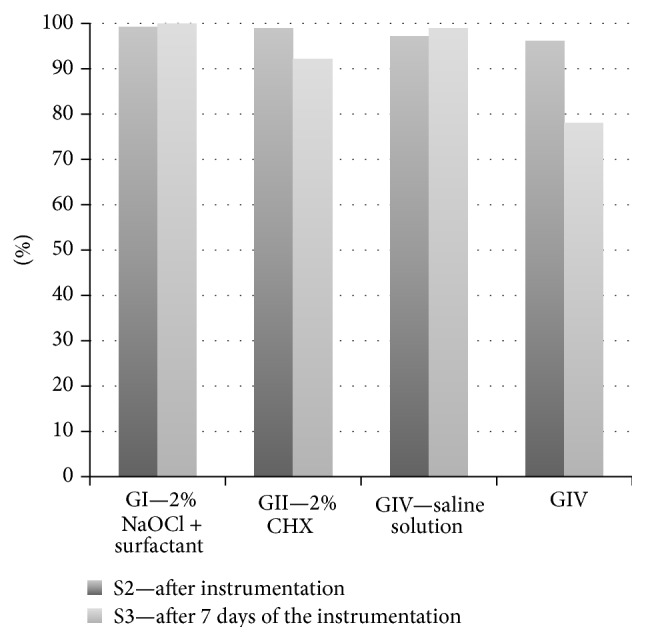
Descriptive analysis of the reduction percentages in the first and second samplings (S2 and S3) in relation to the initial sampling (S1).

Descriptive analysis of the reduction percentages in the first and second samplings (S2 and S3) in relation to the initial sampling (S1).