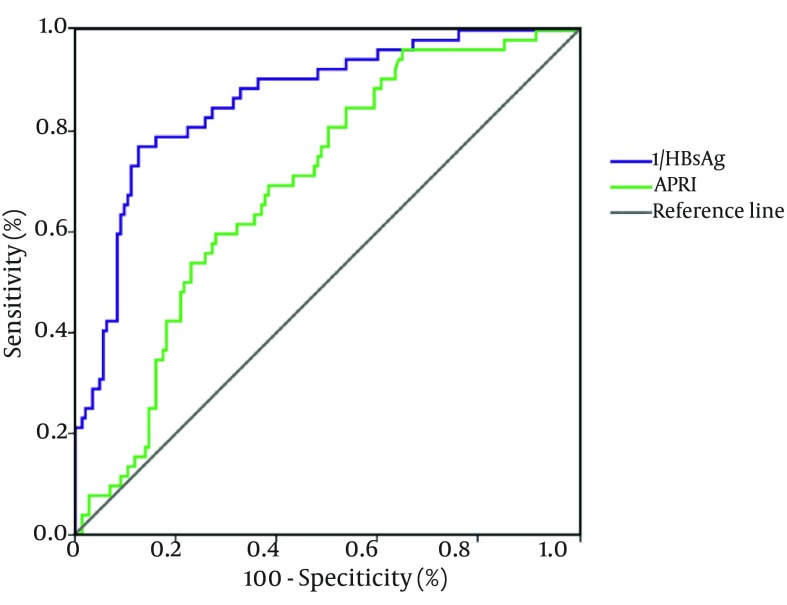
Figure 2. The Differences in HBsAg Serum Levels for Different Stages of Fibrosis.
Serum HBsAg were expressed as mean ± standard deviation, the results showed that serum HBsAg decreased with the process of fibrosis. There was a strong inverse correlation between serum HBsAg and fibrosis (r = -0.668, P < 0.001). Abbreviations: HBsAg, hepatitis B surface antigen.

