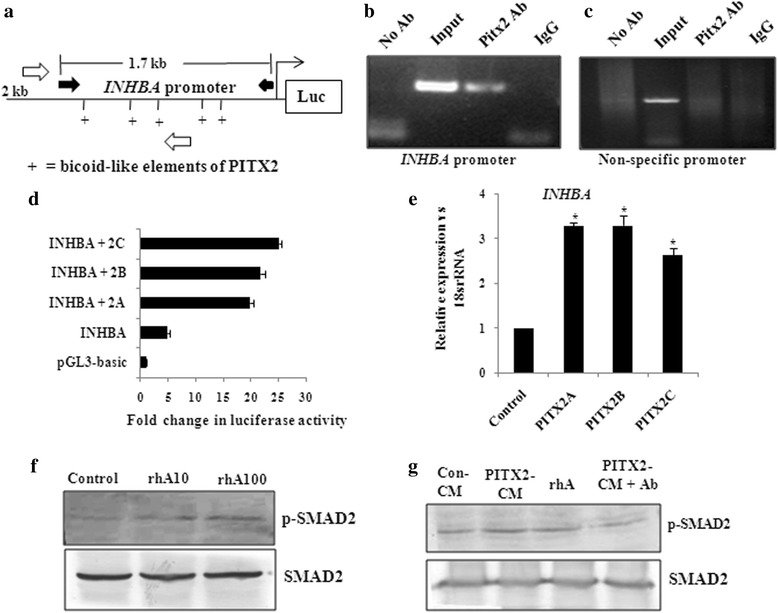
Fig. 5.

PITX2-regulated INHBA activates SMAD2 level. a Schematic diagram shows the 2 kb upstream region of INHBA promoter with the PITX2-specific bicoid-like (as +) elements. Here, the location of primers used to clone 1.7 kb region in pGL3 vector has been depicted with black solid arrow, while that used for ChIP-PCR has been shown with hollow arrows. b-c ChIP with SKOV-3 cells followed by the PCR showed the amplification of the INHBA promoter (b) from the chromatin input and from PITX2-IP DNA as indicated in the lanes. The PITX2 antibody used in this assay recognizes all three isoforms of PITX2. Amplification of respective promoters was not observed by PCR performed with IgG-IP and no antibody control sets. c Primers of an unrelated gene did not show amplification from PITX2-IP DNA. (d) The INHBA promoter as shown in Fig A was cloned into pGL3-basic vector. OAW-42 cells were transiently co-transfected with the construct alone or in combination with PITX2 isoforms followed by luciferase assay. The reporter activity of each clone was calculated in terms of fold change in PITX2-overexpressed cells compared with empty vector-transfected cells, after normalization with renilla luciferase activity. e Q-PCR analysis of the INHBA gene with specific primers was performed with the RNA isolated from PITX2A/B/C-transfected OAW-42 cells. Relative gene expression is indicated as ‘fold’ change in the Y-axis (mean ± SEM). The statistical analysis is done as described previously.* represents p < 0.05. f Western blot was performed to check the level of p-SMAD2 in OAW-42 cells after treatment with rhActivin-A (rhA10: 10 ng/ml and rhA100: 100 ng/ml) for 30 mins. g The levels of p-SMAD2 was assessed on treating the cells with PITX2A-conditioned medium (PITX2-CM), rhActivin-A (rhA: 100 ng/ml) or PITX2-CM in presence of activin neutralizing antibody (Pitx2-CM + Ab)
