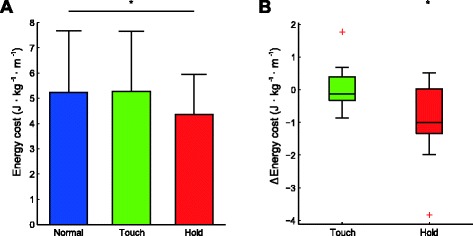
Fig. 1.

a. Effect of light touch and handrail hold on the net energy cost of walking. b. boxplot of the difference between Touch and Normal, and Hold and Normal. The central mark is the median, the edges of the box are the 25th (q1) and 75th (q3) percentiles. Whiskers extend to the last datapoint > q 1 − 1.5(q 3 − q 1) or < q 3 + 1.5(q 3 − q 1). Datapoints outside this range are shown as a red cross. * = significantly different from NORM at p < .05
