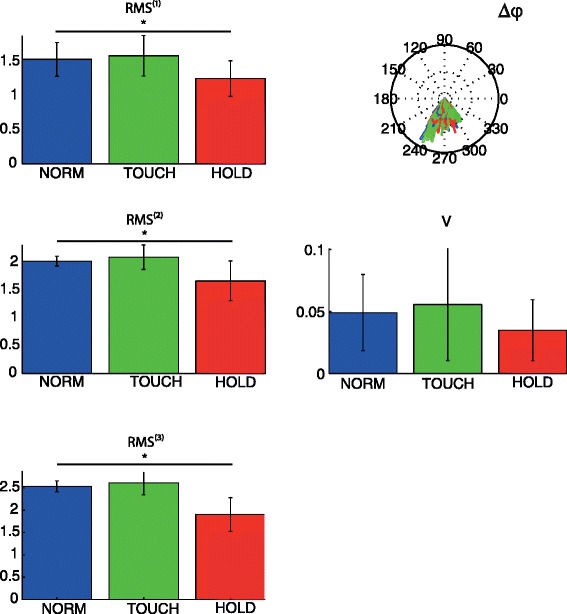
Fig. 5.

Changes in muscle activation patterns based on PCA analysis. Left column: root mean squared value (RMS (j)) for first three modes for each condition averaged over subjects. Right column: Relative phase distribution plot (∆φ), for relative phase between mode 1 and 2, and variance (V) in relative phase between mode 1 and 2. As can be seen, the relative phase between mode 1 and 2 is centered between 240 and 300 (or: −60 and −100) degrees
