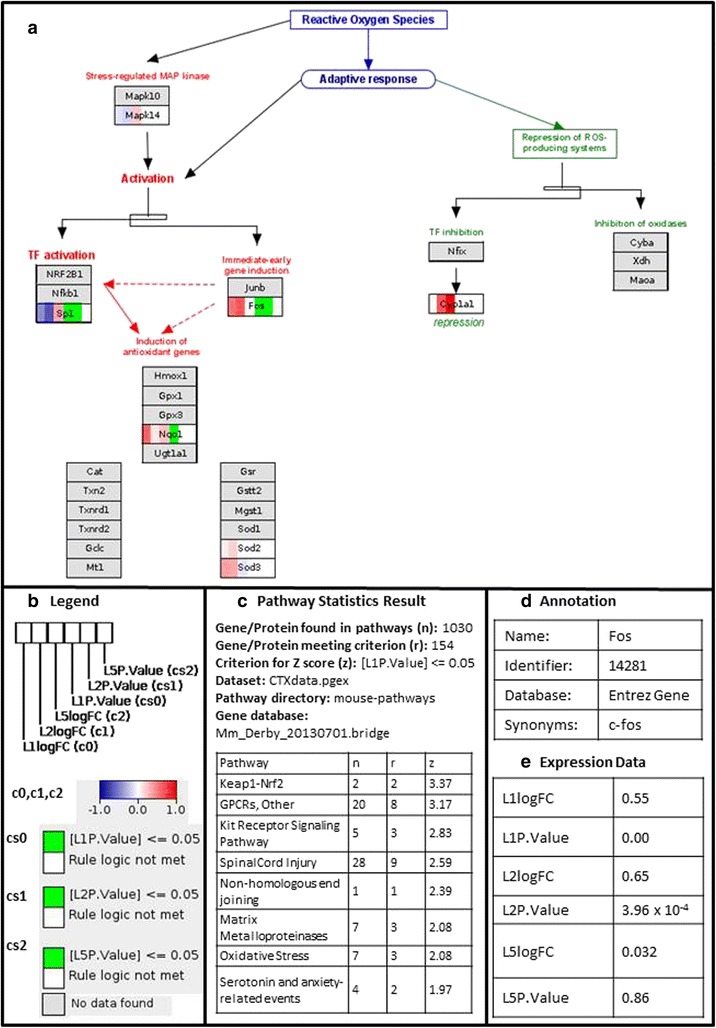
Fig. 2.

Pathway Statistics Results for PBMCs. a Oxidative stress pathway [49] for PBMCs showing the logFC and P-value for day 1, day 2 and day 5, (b) Legend showing the colour gradients and rules used to visualise logFC and P-value of the genes, every data node is divided into 6 columns, 3 for the logFCs and 3 for the P-values of PBMCs (L) at the three time points, day 1 (1), day 2 (2) and day 5 (5) (c) Parameters used to calculate the Z score and ranked list of pathways, and (d) Back page showing the annotation for the gene Fos, (e) Back page showing the gene expression data for PBMCs for the gene Fos for day 1, day 2, and day 5
