
Figure 1.
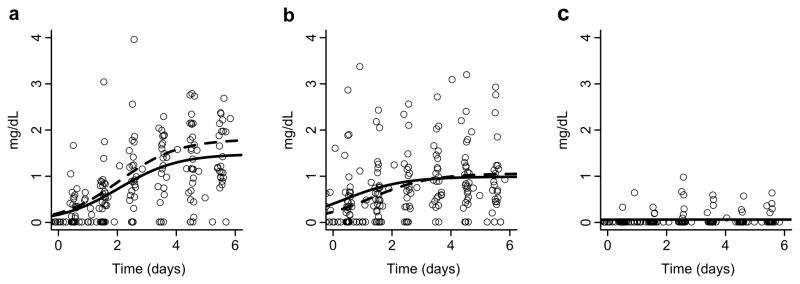
Serial phytosterol levels in infants after the initiation (a–c) of SO lipid. Circles represent individual phytosterol levels. Black lines indicate model fit curve using the median of all individual kinetic parameters for the accumulation of (a) sitosterol, (b) campesterol, and (c) stigmasterol. Dashed lines represent model fit curve using the median of filtered individual fits.