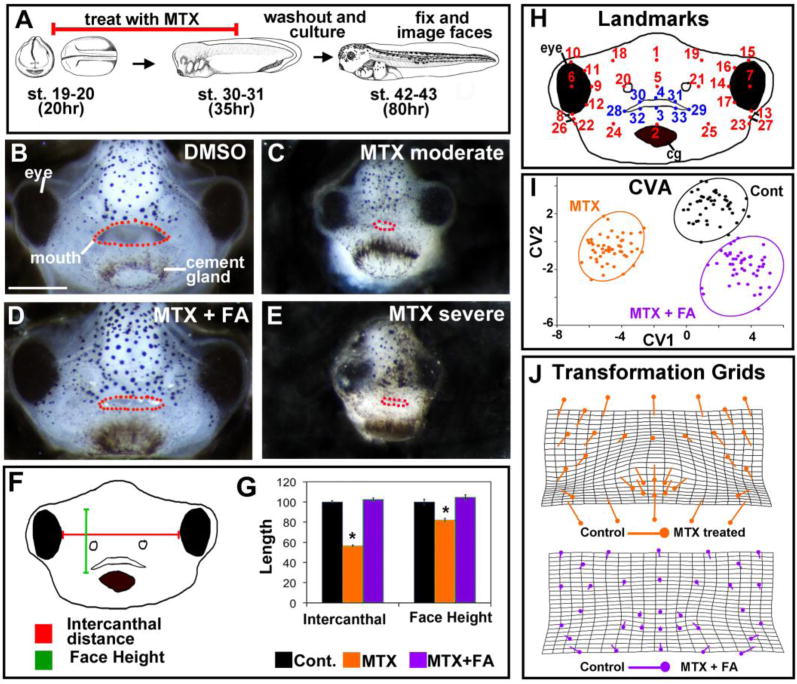
Figure 3.

Pharmacological inhibition of DHFR alters size and shape of the face. A) Schematic of the experimental design. B–E) Representative frontal views of faces treated with DMSO (B), 220 μM MTX (C, E) and 220 μM MTX + folinic acid (FA) (D). All images were taken at same magnification (scale bar =150μm). Mouth is outlined in red dots. F) Schematic of the facial dimensions measured. G) Bar graphs of the quantification of facial dimensions for 2 experiments (n=20). Asterisks designate statistical difference when compared to control (all p values ≤ 0.001). H) Landmark locations for morphometric analysis. I) Canonical variate analysis of landmark coordinates. Statistically significant for 2 experiments, n=10, p value ≤0.05). J) Transformation grids showing the change in landmark position in MTX treated embryos compared to controls (top grid) and controls compared to rescued embryos (bottom grid).
