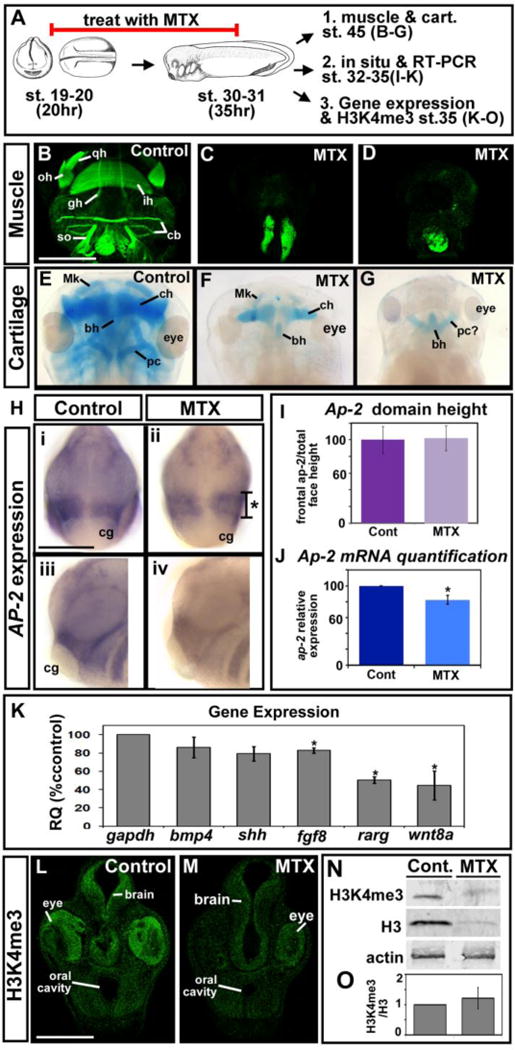
Figure 4.

Inhibition of DHFR alters jaw muscle and cartilage, gene expression and total histone levels. A) Schematic of the experimental design. B–D) Representative ventral views of embryos labeled with phalloidin to mark muscle. Images are all at the same magnification (scale bar =500 μm), 2 experiments (n=14). E–G) Representative dorsal views of embryos labeled with Alcian blue to show cartilage. Images are all at the same magnification (scale bar =500 μm), 2 experiments (n=20). H) in-situ hybridization for neural crest marker, AP-2, frontal views (i, ii) and lateral views with anterior to the left (iii, iv). All images are at the same magnification (scale bar = 175 μm). Asterisk designates the region measured and graphed in I. I) Bar graph showing quantification of the AP-2 domain in the face. There is no statistical significance in 2 experiments (n=12, p value = 0.64). J) Bar graph showing quantification of AP-2 mRNA levels by qRT-PCR. Statistical significance designated by asterisk, 2 experiments. K) mRNA levels of genes expressed in the face relative to GAPDH. Asterisks designate statistical significance (p values for significance are all ≤ 0.005). M–N) Immunohistochemistry of H3K4me3 in representative transverse sections of the face (2 experiments, n=10). Images are at the same magnification (scale bar =100 μm). N) Representative western blot of H3K4me3, total H3 and actin (n=2 experiments). P) The ratio of H3k4me3 to H3 from 2 experiments is not statistically different (p value=0.589). Abbreviations; gh=Geniohyoideus, ih=Interhyoideus, so=Subarcualis obliquus II, oh=Orbitohyoideus, qh=Quadrato-hyo-angularis, cb=Constrictores branchialium, Mk= Meckel’s cartilage, ch= ceraohyal cartilage, bh=basihyal cartilage, pc=parachordal cartilage.
