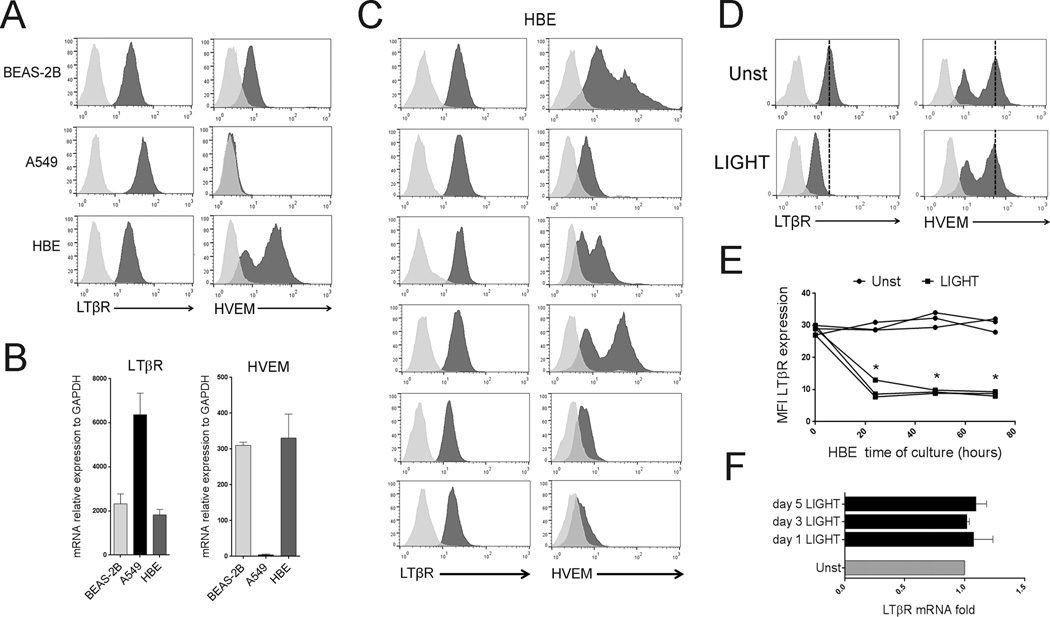
Figure 1. Expression of LTβR and HVEM in lung epithelial cells.
The human bronchial epithelial cell line, BEAS-2B, the human alveolar cell line, A549, and human primary bronchial epithelial (HBE) cells were assessed by flow cytometry (A, C, D, E) and mRNA analysis (B, F) for expression of LTβR and HVEM. (A) LTβR and HVEM, black histograms, on representative samples of all cell populations. Isotype control, gray histograms. (B) Mean mRNA expression in all cell populations, n=3 independent experiments. (C) Staining of HBE cells from 6 individual donors. (D–F) HBE cells were cultured in the absence (Unst) or presence of recombinant LIGHT. (D) Representative LTβR and HVEM expression assessed by flow at 48hr. Dashed line indicates peak receptor expression in unstimulated cells. Data representative of three independent experiments. (E) MFI of LTβR expression by flow from 3 donors over time; (F) Mean LTβR mRNA levels of HBE over time, n=3 independent experiments.

