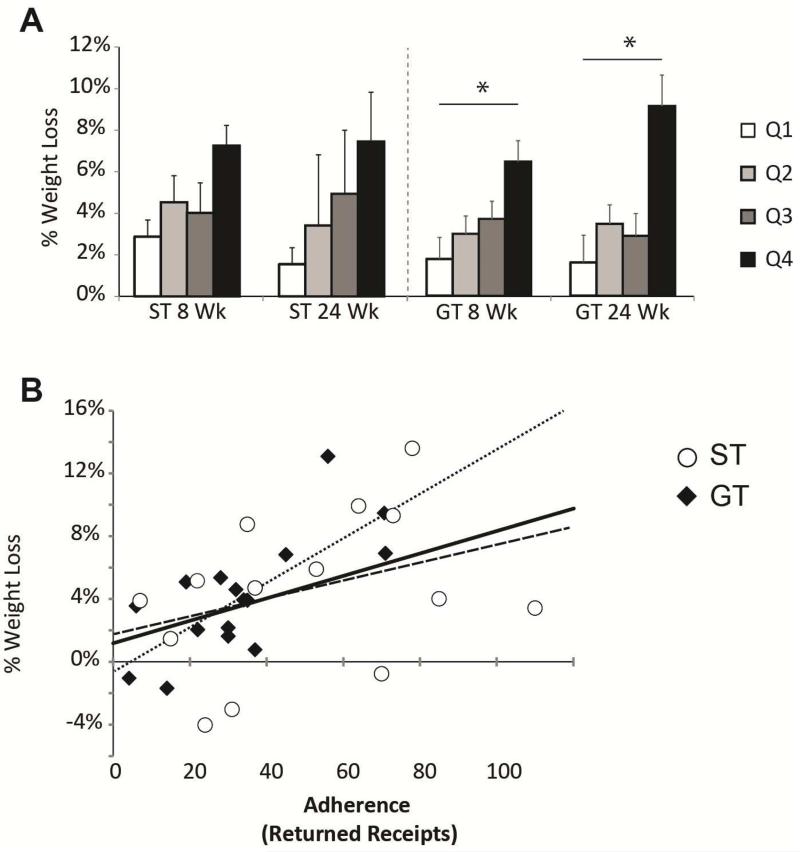
Figure 3.
Adherence and weight loss. (A) Adherence was measured by the amount of receipts of Healthy Choice meals returned for reimbursement during the first 8 weeks. Those in the top quartile of the GT participants lost significantly more weight than those in the bottom two quartiles, whereas this wasn't true for the ST group. (* p <0.05). (B) Correlation plot showing the relationship between returned receipts (a measure of adherence) and percent weight loss. Solid line shows trend line for all participants, (R = 0.47; p = 0.001). Dotted line shows trend line for GT participants ((R = 0.74, p = 4.0 × 10⁻⁵) and dashed line shows trend line for ST participants (R = 0.34, p = 0.23).

